
Author

admin

Browsing

Dalaroo Metals Ltd (ASX: DAL, “Dalaroo” or “Company”) is pleased to announce the results of its 2025 exploration program completed at the Company’s 100%-owned Blue Lagoon Project in Greenland (Figure 1).

Highlights

  • Maiden sampling program at the Blue Lagoon Project (Blue Lagoon) unlocks new Zirconium (Zr) and Rare Earth Elements (REE) potential district in Greenland.
  • First sampling program at Blue Lagoon since 1979 has successfully returned elevated Zr + REE mineralisation. All 113 samples returned anomalous values, across a ~2.7km strike – indicating a highly prospective new critical metals district in Greenland.

Zirconium & Hafnium

  • Exceptional high-grade Zirconium Oxide (ZrO2) and Hafnium Oxide (HfO2) surface samples include:
    • 4.42% ZrO2 & 98ppm HfO2 (Sediment Sample 26818D)
    • 4.09% ZrO2 & 99ppm HfO2 (Sediment Sample 26817D)
    • 3.82% ZrO2 & 82ppm HfO2 (Sediment Sample 26808D)
    • 3.58% ZrO2 & 61ppm HfO2 (Sediment Sample 26820D)
    • 3.13% ZrO2 & 62ppm HfO2 (Sediment Sample 26803D)
    • 2.85% ZrO2 & 73ppm HfO2 (Sediment Sample 26806D)
  • >2% ZrO2 and >40ppm HfO2 encountered in auger holes and sediment samples across the entire ~2.7km strike, indicating a large-scale, broad and well mineralised target area.
  • Hafnium is a critical semiconductor metal, which has become vital for supercharging the next-generation microchips and semiconductors, due to its high-K constant (dielectric constant) allowing Hafnium to store significantly more electrical charge than traditional SiO2 based semiconductors.
  • HfO2 has a K-constant approximately ~6x higher than SiO2, with one of the highest melting points of any compound, resulting in >1000x reduction in electron leakage through transistors versus SiO2 – underpinning the next generation of high-performing semiconductors1.
  • HfO2 (High Purity) indicative sale price currently at AU $16,297/kg, reflecting its advanced chemical properties, increasing demand in high‑tech applications, and the scarcity of hafnium‑bearing minerals2.
    • Blue Lagoon sampling has confirmed a ~2.7km strike with >2% ZrO2 and >40ppm HfO2 at surface, with potential for Hafnium grades to concentrate further at depth, subject to drilling confirmation.

Rare Earths

  • The Blue Lagoon Project has returned high-grade REE results with consistent elevated Magnet Rare Earth Oxides (MREO)13 encountered at surface, with Total Rare Earth Oxide (TREO)13,16 grades highlighted by:
    • 8,079 ppm TREO with 29% MREO (Sediment Sample 26824D)
    • 6,491 ppm TREO with 27% MREO (Sediment Sample 26801D)
    • 5,668 ppm TREO with 27% MREO (Sediment Sample 26824C)
    • 5,654 ppm TREO with 27% MREO (Sediment Sample 26823D)
    • 5,519 ppm TREO with 25% MREO (Sediment Sample 26818D)
  • Blue Lagoon has shown exceptional Heavy Rare Earth Oxides (HREO)14,15 enriched in Dysprosium (Dy2O3) and Terbium (Tb4O7) grades encountered at surface, unlocking a new completely untapped district in Greenland:
    • 886ppm HREO (Sediment Sample 26824D)
    • 752ppm HREO (Sediment Sample 26801D)
    • 742ppm HREO (Sediment Sample 26823D)
    • 682ppm HREO (Sediment Sample 26807D)
    • 654ppm HREO (Sediment Sample 26806D)
    • 628ppm HREO (Sediment Sample 26818D)
    • 615ppm HREO (Sediment Sample 26808D)
    • 597ppm HREO (Sediment Sample 26824C)
    • 596ppm HREO (Sediment Sample 26817D)
    • 589ppm HREO (Sediment Sample 26822D)
    • 559ppm HREO (Sediment Sample 26820D)
  • TREO grades and HREO grades have the strong potential to improve as Dalaroo continues to assess full district potential of the Blue Lagoon Project and drill test immediate targets to determine the scale of the mineralised system.
  • Importantly, sampling at Blue Lagoon has returned low Uranium levels, with a maximum reading of 25ppm U3O8 which has the potential to simplify processing complexities and encouragingly falls below the 100ppm uranium threshold levels for permitting in Greenland
  • Placer & Liberated REE Potential: These exceptional REE grades were encountered at surface, consistently over the entire ~2.7km strike. With the natural weathering having enriched the REE into beach-like alluvial sediments – indicating potential for a proximal placer style REE deposit, where REE grains have been freely-liberated and has the potential to produce a REE concentrate through low CAPEX, simple physical separation methods.

Click here for the full ASX Release

This post appeared first on investingnews.com
(TheNewswire)


Prismo’s Interest Currently Stands at 95% With Option for Full Control

Vancouver, British Columbia, January 16th, 2025 TheNewswire – Prismo Metals Inc. (‘Prismo’ or the ‘Company’) (CSE: PRIZ,OTC:PMOMF) (OTCQB: PMOMF) is pleased to announce that it has completed its previously announced transaction with Infinitum Copper Corp. (TSXV: INFI) (‘Infinitum’) whereby Prismo has increased its interest in the Hot Breccia copper project, located in the heart of Arizona’s prolific copper belt, from 75% to 95%. In addition, Prismo has obtained an irrevocable option to acquire Infinitum’s remaining 5% interest, providing a clear path to 100% interest in the project.

Alain Lambert, CEO of Prismo commented: ‘This transaction marks a significant milestone for Prismo and provides a clear mechanism to securing full ownership of Hot Breccia. It materially improves the strategic flexibility of the project.’

He added: ‘Prismo remains firmly committed to advancing Hot Breccia. The recent extension of certain milestone obligations under the option agreement with Walnut Mines LLC, the owner of the Hot Breccia claims, together with the completion of the transaction with Infinitum, provides the Company with additional flexibility as we evaluate a range of strategic alternatives. Each of these pathways’ goal is to drill what we consider to be one of the most compelling copper exploration opportunities in Arizona and the broader United States.

Dr. Linus Keating, manager of Walnut Mines LLC, enthusiastically commented: ‘Walnut Mines is solidly in favor of any action that moves Hot Breccia closer to a serious drill program. We are hopeful that this transaction will accomplish that goal in 2026. In our opinion, this property remains one of the best copper exploration opportunities in North America.’

Under the terms of the transaction, Prismo paid Infinitum CA $185,000 to acquire a 20% additional interest in the Hot Breccia project and assumed all of Infinitum’s remaining obligations under the existing option agreement with Walnut to issue shares to Walnut, which has been satisfied by the issuance to Walnut of 450,630 common shares at a deemed issue price of $0.11 per share. Prismo has also agreed to pay Infinitum 5% of any consideration received in connection with a transaction in which Prismo assigns its interest in Hot Breccia to a third party to acquire the 5% interest held by Infinitum.

Prismos Hot Breccia project lies at the heart of the Arizona Copper Belt, which hosts several globally significant porphyry copper deposits.  Examples of these significant deposits are Freeport McMoRan’s Miami-Inspiration mining complex, BHP’s San Manuel mine, Rio Tinto and BHP’s Resolution deposit and others (see Figure 1).  


Figure 1. Location of the Hot Breccia Project in the Arizona Copper Belt.

The Company wishes to update its January 12th, 2026 news release to confirm that the Company issued 2,250,000 units for gross proceeds of $225,000 and issued 140,000 Finder’s Warrants and paid finder’s commissions of $14,000 to a certain qualified finder. Each Unit consisted of one common share in the capital of the Company (a ‘Share‘) and one common share purchase warrant of the Company (a ‘Warrant‘). Each Warrant entitles the holder to purchase one Share for a period of thirty-six (36) months from the date of issue at an exercise price of $0.175. Prismo intends to proceed next week a final closing of 1,500,000 Units for gross proceeds of $150,000.

About Prismo Metals Inc.

Prismo (CSE: PRIZ,OTC:PMOMF) is a mining exploration company focused on advancing its Hot Breccia copper project in Arizona and its Palos Verdes silver project in Mexico.

Please follow @PrismoMetals on , , , Instagram, and

Prismo Metals Inc.

1100 – 1111 Melville St., Vancouver, British Columbia V6E 3V6  Phone: (416) 361-0737

Contact:

Alain Lambert, Chief Executive Officer alain.lambert@prismometals.com

Gordon Aldcorn, President gordon.aldcorn@prismometals.com

Cautionary Note Regarding Forward-Looking Information

This release includes certain statements and information that may constitute forward-looking information within the meaning of applicable Canadian securities laws. Forward-looking statements relate to future events or future performance and reflect the expectations or beliefs of management of the Company regarding future events. Generally, forward-looking statements and information can be identified by the use of forward-looking terminology such as intends‘ or anticipates, or variations of such words and phrases or statements that certain actions, events or results may’, could‘, should‘, would‘ or occur. This information and these statements, referred to herein as ‘forwardlooking statements’, are not historical facts, are made as of the date of this news release and include without limitation, statements regarding discussions of future plans, estimates and forecasts and statements as to management’s expectations and intentions with respect to, among other things: the timing, costs and anticipated results of drilling at Hot Breccia; the ability of Prismo to fund drilling and pursue potential third-party partnerships; the Company’s strategic flexibility with respect to the Hot Breccia project going forward; the number of shares issuable by Prismo to Walnut pursuant to the transaction described in this news release; and the Company’s expectations regarding mineralization and other qualities of the Hot Breccia project.

These forwardlooking statements involve numerous risks and uncertainties, and actual results might differ materially from results suggested in any forward-looking statements. These risks and uncertainties include, among other things: delays in obtaining or failure to obtain appropriate funding to finance the exploration program at Hot Breccia; the risk that the Company will not enter into a third-party partnership with respect to the Hot Breccia project; the risk that mineralization will not be as anticipated at the project; the risk that the Company will not be able to take advantage of geological information to refine drill targeting; metal prices; market uncertainty; and other risks and uncertainties application to exploration activities and the Company’s business as set forth in the Company’s disclosure documents available for viewing under the Company’s profile on SEDAR+ at www.sedarplus.com.

In making the forward-looking statements in this news release, the Company has applied several material assumptions, including without limitation, that: the ability to raise capital to fund the drilling campaign at Hot Breccia and the timing of such drilling campaign; the ability of the Company to enter into a third-party partnership on the project; that the project will have the anticipated mineralization and other qualities; and the  Company will be able to take advantage of geological information to refine drill targeting.

Although management of the Company has attempted to identify important factors that could cause actual results to differ materially from those contained in forward-looking statements or forward-looking information, there may be other factors that cause results not to be as anticipated, estimated or intended. There can be no assurance that such statements will prove to be accurate, as actual results and future events could differ materially from those anticipated in such statements. Accordingly, readers should not place undue reliance on forward-looking statements and forward-looking information. Readers are cautioned that reliance on such information may not be appropriate for other purposes. The Company does not undertake to update any forward-looking statement, forward-looking information or financial out-look that are incorporated by reference herein, except in accordance with applicable securities laws. We seek safe harbor.

Copyright (c) 2026 TheNewswire – All rights reserved.

News Provided by TheNewsWire via QuoteMedia

This post appeared first on investingnews.com
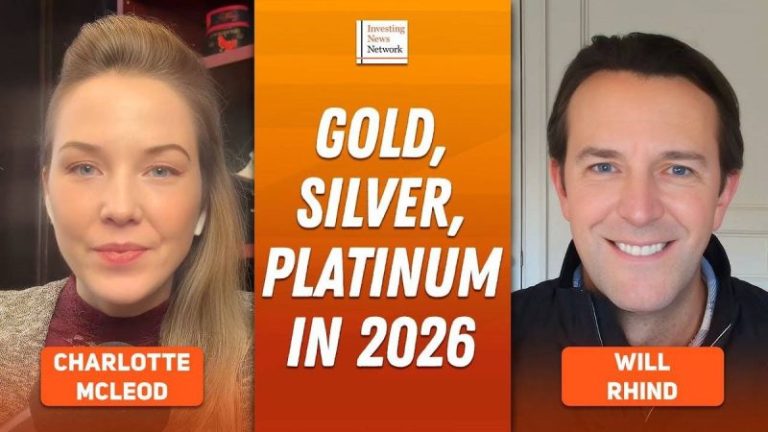
Will Rhind, CEO of GraniteShares, outlines his thoughts on gold and silver heading into 2026, noting that historical precedents point to higher prices.

‘Clearly when you look back on some of those other periods for gold — and silver particularly — where they went to all-time highs, then we could be talking about a lot higher prices,’ he said.

Securities Disclosure: I, Charlotte McLeod, hold no direct investment interest in any company mentioned in this article.

This post appeared first on investingnews.com

The company that owns the iconic luxury retailer Saks Fifth Avenue filed for bankruptcy late Tuesday.

The move comes after Saks Global struggled with debt it took on to buy rival Neiman Marcus, lagging department store sales and a rising online market.

It’s one of the largest retail collapses since the Covid pandemic, and casts further doubt over the future of luxury fashion.

The retailer, which also owns Bergdorf Goodman, said early Wednesday its stores would remain open for now after it finalized a $1.75 billion financing package and appointed a new CEO.

The court process is meant to give the luxury retailer room to negotiate a debt restructuring with creditors or sell itself to a new owner to stave off liquidation. Failing that, the company may be forced to shutter.

Former Neiman Marcus CEO Geoffroy van Raemdonck will replace Richard Baker, who was the architect of the acquisition strategy that left Saks Global saddled with debt.

The company also appointed former Neiman Marcus executives Darcy Penick and Lana Todorovich as chief commercial officer and chief of global brand partnerships at Saks Global, respectively.

Saks Fifth Avenue, the retail arm of Saks Global, listed $1 billion to $10 billion in assets and liabilities, according to court documents filed in U.S. Bankruptcy Court in Houston.

A retailer long loved by the rich and famous, from Gary Cooper to Grace Kelly, Saks fell on hard times after the pandemic, as competition from online outlets rose, and brands started more frequently selling items through their own stores.

The original Saks Fifth Avenue store, known for displaying the likes of Chanel, Cucinelli and Burberry, was opened by retail pioneer Andrew Saks in 1867.

The new financing deal would provide an immediate cash infusion of $1 billion through ‌a loan from an investor group, Saks Global said.

A host of luxury brands were among the unsecured creditors, led by Chanel and Gucci owner Kering at about $136 million and $60 million respectively, the court filing said. The world’s biggest luxury conglomerate, LVMH, was listed as an unsecured creditor at $26 million. In total, Saks Global estimated there were between 10,001 and 25,000 creditors.

In 2024, Baker had masterminded the takeover of Neiman Marcus by Canada’s Hudson’s Bay Co, which had owned Saks since 2013, and later spun off the U.S. luxury assets to create Saks Global, bringing together three names that have defined American high fashion for more than a century.

The deal was designed to create a luxury powerhouse, but it saddled Saks Global with debt at a time when global luxury sales were slowing, complicating an already difficult turnaround for CEO and veteran executive Marc Metrick.

Saks Global struggled last year to pay vendors, who began withholding inventory, disrupting the company’s supply chain and leaving it with insufficient stock.

The thinly stocked shelves may have driven shoppers away to rivals like Bloomingdale’s, which posted strong sales in 2025, compounding pressure on Saks Global.

“Rich people are still buying,” Morningstar analyst David Swartz said last month, “just not so much at Saks.”

Running out of cash, Saks Global last month sold the real estate of the Neiman Marcus Beverly Hills flagship store for an undisclosed amount. It had also been looking to sell a minority stake in exclusive department store Bergdorf Goodman to help cut debt.

On Dec. 30, it failed to make an interest payment of more than $100 million to bondholders.

This post appeared first on NBC NEWS

Exchange-traded funds (ETFs) have become popular in North America in a wide range of industries, including the clean energy sector, whose appeal is rapidly increasing.

For investors looking to gain exposure to the cleantech market, investing in individual stocks can be daunting considering the broad reach of this market sector.

The cleantech umbrella covers a range of sectors, including renewable energy technologies, such as wind and solar; battery technologies for electric vehicles and large-scale energy storage systems; agritech, water treatment and air purification systems; built environment technologies; carbon capture, biofuels and green hydrogen.

ETFs have become so popular partially because they provide a safer way for investors to gain exposure to various industries while avoiding the volatility that comes with investing in individual stocks, making ETFs a good fit for investors looking for exposure to the cleantech sector’s many options.

Below is a look at the five top clean energy ETFs to consider, ranked by total assets under management. All numbers and figures were gathered using ETFdb.com and were current as of January 13, 2026. Read on to learn about the options available to investors.

1. iShares Global Clean Energy ETF (NASDAQ:ICLN)

Total assets under management: US$2 billion
Expense ratio: 0.39 percent

The iShares Global Clean Energy ETF was created on June 24, 2008, and has a large portfolio of domestic and international stocks. An analyst report on the ETF states that it ‘likely doesn’t deserve’ a large weighting in an investor’s long-term portfolio. It suggests that the fund could instead be useful as a satellite holding that looks at a fraction of the market that is often overlooked by less focused ETFs.

The iShares Global Clean Energy ETF has 103 holdings. Three of its top-weighted holdings are Bloom Energy (NYSE:BE), First Solar (NASDAQ:FSLR) and Sunrun (NASDAQ:RUN). In terms of performance, this ETF has a one year return rate of 59.37 percent.

2. Invesco WilderHill Clean Energy ETF (ARCA:PBW)

Total assets under management: US$761.07 million
Expense ratio: 0.64 percent

Launched on March 3, 2005, the Invesco WilderHill Clean Energy ETF focuses on clean energy companies using green and renewable energy, and technologies that help with cleaner energy. Its holdings also include mineral companies focused on critical metals necessary for clean energy.

Currently, of the 64 stocks it holds, this ETF’s top-weighted holdings include Bloom Energy, Lifezone Metals (NYSE:LZM), and Lithium Argentina (TSX:LAR). Its one year return rate comes in at 69.48 percent.

3. First Trust NASDAQ Clean Edge Green Energy (NASDAQ:QCLN)

Total assets under management: US$572.57 million
Expense ratio: 0.56 percent

The First Trust NASDAQ Clean Edge Green Energy Index Fund, which came into existence on February 14, 2007, is a unique member of the alternative energy category, according to ETFdb.com. Why? Because it offers broad exposure by also investing in companies across a wide range of green energy subsectors, including biofuels, solar energy and advanced batteries.

Three of its 50 holdings with the highest weights are Bloom Energy, ON Semiconductor (NASDAQ:ON) and Rivian Automotive (NASDAQ:RIVN). The one year return rate for this ETF is 43.45 percent.

4. State Street SPDR S&P Kensho Clean Power ETF (ARCA:CNRG)

Total assets under management: US$195.57 million
Expense ratio: 0.45 percent

The SPDR S&P Kensho Clean Power ETF was launched in October 2018 and tracks companies whose products and services are driving innovation in the clean energy sector, including the areas of solar, wind, geothermal and hydroelectric power. It has 44 holdings.

Three of the fund’s top holdings include Bloom Energy, SolarEdge Technologies (NASDAQ:SEDG), and Ormat Technologies (NYSE:ORA). Its one year return performance stands at 55.67 percent.

5. ALPS Clean Energy ETF (ARCA:ACES)

Total assets under management: US$112.07 million
Expense ratio: 0.55 percent

The ALPS Clean Energy ETF was formed fairly recently, on June 29, 2018. The fund tracks the CIBC Atlas Clean Energy Index, providing exposure to a diverse set of US and Canadian companies involved in the clean energy sector, including renewables and clean technology.

This ALPS ETF has 39 holdings, and some of its top holdings are Albemarle (NYSE:ALB), Ormat Technologies and Sunrun. It has a one year return of 31.92 percent.

Securities Disclosure: I, Melissa Pistilli, hold no direct investment interest in any company mentioned in this article.

This post appeared first on investingnews.com

Exchange-traded funds (ETFs) are a popular investment strategy, and generally contain a variety of publicly traded companies under one stock symbol, often with a focus on a specific sector.

Depending on the ETF, investors may be able to track up-and-coming companies, get exposure to top firms or a mix of both. Aside from stocks, some ETFs also track commodities or bonds.

In the healthcare industry, medical device ETFs bring together companies that go to great lengths to develop medical technologies and equipment that can improve the lives of patients.

What is an exchange-traded fund?

Exchange-traded funds, or ETFs, hold a basket of equities, often focused on a theme or niche. ETFs are appealing because they give investors the ability to hone in on a specific market area without investing in individual companies. While they are similar to mutual funds, ETFs trade on stock exchanges in the same way stocks do.

Put simply, ETFs reduce the risk of investing by providing access to a larger pool of companies — they let investors pick an area that interests them and suffer less financially if one company under the ETF’s umbrella underperforms. In this way, ETFs allow investors to enter the market confidently and hopefully enjoy long-term capital gains.

Like many areas of the life science space, the medical device sector can be volatile, making ETFs particularly appealing. For example, if a company in a medical device ETF fails a clinical trial or receives negative feedback from the US Food and Drug Administration, ETF investors will largely be protected from any share price drop the stock might have.

On the other hand, if a company in a medical device ETF sees a major gain, that increase will also be muted for ETF investors. That’s why some investors prefer to take their chances by adding individual stocks to their portfolios.

Medical device ETFs to consider

Investors keen on medical device ETFs only have three choices, according to ETFdb.com. Other life science ETFs can include medical device stocks in their holdings but cover a broad range of firms, while these three funds offer sector-specific exposure.

Here’s a brief look at the three medical device ETFs available to investors on US exchanges.

1. iShares US Medical Devices ETF (ARCA:IHI)

Total assets under management: US$4.24 billion

The iShares US Medical Devices ETF was launched in 2006 and tracked 50 holdings as of January 8, 2026. IHI has an expense ratio of 0.38 percent.

The majority of its portfolio is made up of large-cap US stocks. Its top three holdings, which combine for over 45 percent of its holdings, are:

        2. SPDR S&P Health Care Equipment ETF (ARCA:XHE)

        Total assets under management: US$161.1 million

        Formed on January 26, 2011, the SPDR S&P Health Care Equipment ETF tracks 67 holdings as of January 8, 2026. This SPDR ETF has an expense ratio of 0.35 percent.

        XHE offers exposure to medical device companies of all sizes, with 30 percent of its holdings being large-cap, 28 percent mid-cap, 37 percent small-cap and about 5 percent being micro stocks. The majority are US-based.

        Its 67 holdings are relatively equally weighted, and its top holdings include UFP Technologies (NASDAQ:UFPT), Lantheus Holdings (NASDAQ:LNTH) and QuidelOrtho (NASDAQ:QDEL).

        3. First Trust Indxx Medical Devices ETF (BATS:MDEV)

        Total assets under management: US$2.2 million

        The First Trust Indxx Medical Devices ETF launched on June 22, 2021, and aims to replicate the performance of the Indxx Medical Devices Index. MDEV has an expense ratio of percent.

        This medical device ETF holds a portfolio of global life science stocks, with significant exposure to North America, European and Asian companies. Its 51 holdings are predominantly large-cap companies at 70 percent, with the remaining 30 percent being mid-cap firms.

        The First Trust Indxx Medical Devices ETF’s top holdings include Exact Sciences (NASDAQ:EXAS), Globus Medical (NYSE:GMED) and Intuitive Surgical (NASDAQ:ISRG).

        Securities Disclosure: I, Melissa Pistilli, hold no direct investment interest in any company mentioned in this article.

        This post appeared first on investingnews.com

        The silver price hit a new all-time high on Wednesday (January 14), rising as high as US$92.20 per ounce.

        The white metal’s most recent rise continues a breakout that began on January 9 on a mixed bag of economic uncertainty, rising geopolitical tensions in Venezuela and Iran and underlying industrial demand strength.

        Adding fuel to the fire this week are increased expectations for a lower interest environment.

        On January 9, the US Department of Justice served the US Federal Reserve with grand jury subpoenas, threatening a criminal indictment over Chair Jerome Powell’s testimony to the Senate Banking Committee this past June.

        The event has sparked concerns that US President Donald Trump’s feud with the Fed over interest rates has taken a darker turn, although Trump has denied knowledge of the department’s move.

        Powell’s term as Fed chair ends in May, but two years still remain on his term as a governor of the board.

        The Fed’s next rate announcement is set for January 28, and CME Group’s (NASDAQ:CME) FedWatch tool shows strong expectations for a hold. That’s despite core consumer price index (CPI) data showing that inflation rose by a lower-than-expected 0.2 percent for December. On an annual basis, core CPI was up 2.6 percent.

        Target rate probabilities for January Fed meeting.

        Chart via CME Group.

        Trump has frequently criticized Powell for not lowering rates quickly enough, and Powell’s replacement, who has not yet been announced, is widely expected to be more in line with Trump’s views.

        “We see increased interference with the Fed as a key bullish wildcard for the precious metals in 2026,” Carsten Menke, head of next-generation research at Julius Baer Group, told Bloomberg. He noted that because silver is a smaller market than gold, it typically reacts “more strongly to such concerns.”

        Silver price chart, January 6 to 14, 2026.

        Silver and its sister metal gold tend to fare better when rates are lower, meaning rate cut expectations coupled with the investigation of Powell and the Fed have helped to stoke prices for the precious metals.

        While silver is known for lagging behind gold before outperforming, it’s now ahead in terms of percentage gains — silver is up about nearly 200 percent year-over-year, while gold has risen around 72 percent.

        The yellow metal also hit a new all-time high on Wednesday, peaking at US$4,641.40 per ounce.

        In addition to rate-related factors, silver’s breakout this year has been driven by various other elements.

        As a precious metal, it’s influenced by many of the same factors as gold, but its October price jump, which took it past the US$50 level, was also driven by a lack of liquidity in the London market.

        While that issue appears to have resolved, silver remains in a multi-year supply deficit. Tariff concerns and silver’s new status as a critical mineral in the US have also provided support.

        In addition to its appeal as a precious metal, silver’s industrial side shouldn’t be forgotten — according to the Silver Institute, the white metal’s ‘global silver industrial demand is poised to grow further as demand from vital technology sectors accelerates over the next five years. Sectors such as solar energy, automotive electric vehicles and their infrastructure, and data centers and artificial intelligence will drive industrial demand higher through 2030.’

        What’s next for the silver price?

        Time will tell what’s next for silver, but some experts see it continuing to outperform gold in 2026.

        ‘So is it going to US$100 or US$200? It’s possible. I don’t really care, because … I don’t use either my silver or my gold as speculative vehicles. That’s not what they’re about to me.’

        Securities Disclosure: I, Melissa Pistilli, hold no direct investment interest in any company mentioned in this article.

        This post appeared first on investingnews.com

        Lithium prices surged to their highest levels in more than two years this week, extending a sharp rally driven by tightening supply and rising demand.

        Benchmark prices for battery-grade lithium carbonate and hydroxide have jumped sharply, with Fastmarkets’ CIF China, Japan and South Korea assessments pushing above US$20,000 a ton.

        Spodumene, the lithium-bearing mineral produced by Australian miners, also climbed above US$2,000 a ton for the first time since October 2023.

        The rally has prompted brokers to reassess their outlooks. Broker Bell Potter this week lifted its price forecasts for spodumene to US$1,750 a ton by year-end, up 89 percent from its previous estimate of US$925.

        While still conservative compared with more bullish projections that expects prices to peak around US$3,250 a ton this year, the upgrade signals a wide shift in sentiment across the sector.

        Momentum has been particularly strong in China, where lithium prices jumped after Beijing announced changes to export tax rebates for battery products. The finance ministry said value-added tax rebates on battery exports will be reduced from 9 percent to 6 percent from April and scrapped entirely from January 1, 2027.

        While the policy does not directly apply to lithium carbonate, investors expect battery makers to accelerate exports ahead of the deadline, lifting near-term production and, in turn, lithium demand.

        That expectation helped push the most-active lithium carbonate contract on the Guangzhou Futures Exchange to its daily limit earlier this week. The contract closed at 156,060 yuan a ton (around US$22,300), its highest level since November 2023 and up more than 160 percent from last year’s lows.

        Analysts have also pointed to low inventories in China, now at their weakest levels since mid-2024, which has positioned the market to be increasingly sensitive to shifts in demand.

        Activity in derivatives markets also suggests the rally is also drawing in a broader set of participants. The Chicago Mercantile Exchange (CME) said trading volumes in its lithium hydroxide futures reached a record 8,296 tons in the first full week of 2026, surpassing the previous high set in early 2025.

        “With the recent surge in spot prices and market activity it’s great to see that volumes are following the price trend,” said Przemek Koralewski, Fastmarkets’ global head of market development. “What a year ago was considered a very strong month, in volume terms, can now be traded in a week, pointing to an increase in available liquidity in the market.”

        The rally comes after what analysts widely describe as one of the lithium market’s most punishing periods in recent memory. The sector entered 2026 following a prolonged downturn driven by deep oversupply, weaker-than-expected electric vehicle demand, and sustained price pressure that forced producers to cut output and delay projects.

        In 2025, lithium carbonate prices in North Asia fell to four-year lows, reflecting the fallout from years of aggressive capacity expansion. Prices began to recover in the second half of last year as supply discipline tightened and inventories started to draw down.

        By late December, lithium carbonate had risen roughly 56 percent from its January 2025 lows. Whether the rally will be sustained will depend on how quickly new supply comes online and whether demand growth meets expectations this year.

        Securities Disclosure: I, Giann Liguid, hold no direct investment interest in any company mentioned in this article.

        This post appeared first on investingnews.com
        S&P Global’s new report, Copper in the Age of AI: The Challenges of Electrification, warns that copper demand could surge 50 percent by 2040, reaching 42 million tonnes as the global push for electrification accelerates.

        Supply, however, is projected to fall short, creating a 10 million tonne deficit, roughly 25 percent below demand , even as production peaks at 33 million tonnes in 2030.

        The looming shortfall signals major opportunities for investors, but experts caution that production must ramp up now to avoid a deepening supply gap later.

        Meeting demand through supply

        ‘Primary production—mining—remains the irreplaceable foundation of copper supply,’ said Global Head of Critical Minerals and Energy Transition Consulting at S&P Global Energy Eleonor Kramarz.

        ‘Bridging the impending supply gap depends not only on geology, engineering, and logistics and investment, but also on governance and policies. That translates into timeliness in permitting and consultation, a time clock on litigation and stability in governance and regulation. The alternative is uncertainty, and uncertainty comes at a hefty cost.’

        The report added that output from existing mines will keep declining without significant new investment.

        Recycling is regarded as the “secondary supply,” but however provides at best only about a third of the total supply by 2040.

        Processing also remains critical in this scenario. Smelting and refining capacity is still concentrated in China, accounting for about 40 to 50 percent total capacity or 12 of the 29 million metric tons to be specific.

        “(This) geographic concentration amplifies systemic risks and exposes the supply chain to geopolitical shocks.”

        “While recycling could possibly meet up to a quarter of total demand by 2040, it cannot close the gap – primary mined supply remains essential,” the report concluded.

        Copper and electrification

        S&P Global wrote that copper also plays a huge role in meeting the growing requirements of electrification and technologies such as AI and data centers.

        It noted that while AI is not creating the largest of copper demand, its requirements highlight the need for expanded electricity supply.

        Still, there is a need to hold space for how AI will affect the generation of industrial, commercial, creative and even personal applications that require more electricity.

        For data centers, the electricity demand in the US could rise from the current 5 percent to 14 percent by 2030.

        “Data centers are electricity-intensive, and their proliferation is driving massive investments in both direct copper use (for power delivery, cooling, and IT infrastructure) and in the electric grid infrastructure that supports them.”

        The report illustrated that to meet the global power demand of 2040, the world will need to build the equivalent of roughly 330 Hoover Dams, or over 650 one-gigawatt nuclear reactors each year between now and then.

        “Copper is the material enabling this massive growth in power demand – unlocking the age of AI and the electrified future of which it is characteristic.”

        A report by Benchmark on annual EV sales revealed that 20.7 million units were sold in 2025, but that the same growth rate of 20 percent “is not expected” to be the same in 2026.

        Noting, “manufacturers (will) focus their efforts on the deadline year, 2027.’

        In terms of overall demand for copper and how it relates to EVs, S&P Global said that demand for ICE vehicles declines due to the growing share of EVs.

        “Construction and machinery continue to be the largest contributors to core economic demand.”

        Australia’s copper developments

        As a nation, Australia is making moves that relate to copper in terms of demand and investment.

        Its Critical Minerals Strategy and Resource Industry Growth Initiative, along with its partnership with Japan, prioritize joint investment and regulatory simplification.

        Using public finance bodies such as the Japan Bank for International Cooperation (JBIC) and JOGMEC, Japan is backing Australian projects to secure long-term access to critical minerals, including copper.

        Firms such as Lynas Rare Earths (ASX:LYC,OTCQX:LYSDY) and their projects also play a role, assisting in securing stable supplies of rare earths, lithium and copper.

        In 2024 and 2025, cooperation under the Japan–Australia Critical Minerals Partnership expanded further, with new processing and infrastructure initiatives announced in Western Australia.

        Large-scale infrastructure projects are also adding to future copper demand. One high-profile example is the proposed AAPowerLink subsea cable project, which would connect Australia to Singapore and Indonesia.

        If developed as planned, the project could consume tens of thousands of tonnes of copper, highlighting how Australia’s export-focused energy and infrastructure strategy is translating into material demand growth.

        Together, these developments underscore how government-backed partnerships and major infrastructure investments are reinforcing Australia’s role as a reliable copper supplier, while creating longer-term opportunities for investors across the copper value chain.

        Addressing the basics

        The demand for copper arises from the fact that it is essential for the generation, transmission and use of electricity.

        The irony is that the metal which enables electrification is having a hard time catching up to the accelerating pace of electrification itself.

        While S&P Global did not have policy recommendations, it implied that current policies may be slowing things down.

        “Average copper mine takes 17 years from discovery to production, with much time spent on permitting, environmental reviews and community consultations.”

        It cited that changing government terms, tariffs and regulatory frameworks are bringing uncertainty to the resource sector, slowing investment and project development.

        The report also noted that while mining is the primary driver of supply, it is only a part of the picture. It’s also about what happens to copper when it leaves mines.

        The conclusion is that the requirement is for multilateral cooperation and increased regional diversification.

        “The future is not just copper-intensive, it is copper-enabled,” S&P Global concluded.

        “As electrification and digital intelligence become defining characteristics of global development, copper is indeed an ever-more critical mineral, carrying the electric currents that are connecting, conducting, and catalyzing innovation and economic advance.”

        Securities Disclosure: I, Gabrielle de la Cruz, hold no direct investment interest in any company mentioned in this article.

        This post appeared first on investingnews.com