Author

admin

Browsing

We also break down next week’s catalysts to watch to help you prepare for the week ahead.

In this article:

    This week’s tech sector performance

    The Nasdaq Composite (INDEXNASDAQ:.IXIC) ended in the green on Monday (February 9) despite a weaker open.

    A rally in tech companies drove US stocks higher ahead of an economic data release, while Asian indexes also rose, led upward by Japan’s tech‑heavy Nikkei 225 (INDEXNIKKEI:NI225).

    It hit new record highs after Prime Minister Sanae Takaichi’s Liberal Democratic Party secured a landslide victory in the Lower House, clearing the path for tax cuts and higher defense spending.

    Tax planning and wealth management stocks fell on Tuesday (February 10) after financial software provider Altruist unveiled an artificial intelligence (AI) tool for creating tax strategies, echoing last week’s selloff in legal software stocks following the debut of a lawyer-focused AI platform.

    Broader tech‑driven weakness and softer‑than‑expected retail‑sales data dragged the Nasdaq down in Tuesday’s session. The index rose again on Wednesday (February 11) after January data showed labor market stability, potentially allowing the US Federal Reserve to keep interest rates steady as it monitors inflation.

    Software stocks resumed their slide, with Alphabet (NASDAQ:GOOGL) at one point down more than 2 percent, Microsoft (NASDAQ:MSFT) falling over 2.5 percent and Amazon (NASDAQ:AMZN) slipping about 1 percent.

    Personal computer makers also fell after Lenovo Group (HKEX:0992,OTCPL:LNVGF) warned of shipment pressure from a memory chip shortage. HP (NYSE:HPQ) and Dell Technologies (NYSE:DELL) each lost about 4.5 percent.

    After a muted close, investors turned their AI disruption fears to yet another corner of the market on Thursday (February 12). This time, it was logistics and trucking stocks, which plummeted after AI logistics firm Algorhythm Holdings (NASDAQ:RIME) said it has scaled freight volumes by 300 to 400 percent without increasing headcount.

    This event showed traders that AI is now affecting sectors previously thought to be resistant to automation and AI‑driven efficiency gains, leading to selloffs that also spilled into real estate and drug distribution.

    All three major indexes closed lower, with the Nasdaq hit hardest.

    A softer-than-expected US consumer price index report released on Friday (February 13) morning reinforced beliefs that the Fed is likely to cut interest rates this year, while global concerns about potential AI-driven disruptions kept investors cautious. European and Asian indexes lost ground, tracking Wall Street’s losses.

    While the S&P 500 (INDEXSP:.INX) closed slightly ahead on the day, mega-cap tech stocks dragged on the Nasdaq, which closed the week 1.77 percent below Monday’s open.

    3 tech stocks moving markets this week

    1.Cloudflare (NYSE:NET)

    Cybersecurity firm Cloudflare saw its share price surge after its sales guidance for the current quarter exceeded expectations. Shares closed 13.07 percent higher for the week.

    2. Applied Materials (NASDAQ:AMAT)

    Applied Materials, a provider of materials engineering solutions for the semiconductor sector, saw its share price rise sharply after reporting better-than-forecast quarterly financial results. Shares advanced 10.05 percent.

    3. Taiwan Semiconductor Manufacturing Company (NYSE:TSM)

    Taiwan Semiconductor Manufacturing Company rose after D.A. Davidson analyst Gil Luria gave it a ‘buy’ rating with a US$450 price target and called it a top AI foundry name. Shares advanced 5.02 percent.

    Cloudflare, TSMC and Applied Materials performance, February 9 to 13, 2026.

    Chart via Google Finance.

    Top tech news of the week

        • Alphabet completed two bond sales this week, raising a combined total of nearly US$52 billion. On Monday, the company sold US$20 billion in US dollars, followed by a nearly US$32 billion multi‑currency bond sale in British pounds and Swiss francs completed within 24 hours on Tuesday.

                                    Tech ETF performance

                                    Tech exchange-traded funds (ETFs) track baskets of major tech stocks, meaning their performance helps investors gauge the overall performance of the niches they cover.

                                    This week, the iShares Semiconductor ETF (NASDAQ:SOXX) advanced by 2.56 percent, while the Invesco PHLX Semiconductor ETF (NASDAQ:SOXQ) advanced by 1.89 percent.

                                    The VanEck Semiconductor ETF (NASDAQ:SMH) also increased by 2.19 percent.

                                    Tech news to watch next week

                                    Tech stocks face a quieter earnings backdrop next week, with no mega‑cap AI giants reporting; instead, the sector will be trading on macro cues and any guidance hints from mid‑tier semis and software names.

                                    Key US data includes jobs‑related releases and consumer confidence surveys.

                                    Securities Disclosure: I, Meagen Seatter, hold no direct investment interest in any company mentioned in this article.

                                    This post appeared first on investingnews.com

                                    Rio Tinto (ASX:RIO,NYSE:RIO,LSE:RIO) and Glencore (LSE:GLEN,OTCPL:GLCNF) said they will no longer be pursuing a merger, with Rio Tinto noting that the combination of the businesses would not deliver value to its shareholders.

                                    Glencore responded to Rio Tinto by saying that under the terms of the proposal, the Rio Tinto executive group would retain both the chair and CEO roles, which would undervalue Glencore’s contribution to the combined company.

                                    The deal would have created the world’s largest mining company with a combined market cap of US$260 billion. While the collapse of the proposed merger is drawing headlines, it comes at an accelerated pace for mergers and acquisitions in the industry, as majors seek to replenish their project pipelines and mid-cap producers look to grow their businesses.

                                    Among other notable mergers still on the books is Anglo American’s (LSE:AAL,OTCQX:NGLOY) merger with Canada-based Teck Resources (TSX:TECK.A,TECK.B,NYSE:TECK). That deal is currently working its way through regulatory approvals, with the most recent update that it is heading toward antitrust clearance in Europe.

                                    On Wednesday (February 11), Indonesia’s resources ministry ordered Eramet (EPA:ERA,OTCPL:ERMAF) and its joint venture partners, Tsingshan Holding Group, to slash production at the world’s largest nickel mine.

                                    Under the new work and budget plan, PT Weda Bay Nickel has been granted an initial quota of 12 million metric tons, down from the 42 million metric tons it was allowed in 2025.

                                    Nickel has been elevated this year, trading as high as US$18,725 on February 2. Although prices have fallen since that high, the announcement gave nickel some momentum, pushing prices to US$17,720 per metric ton on the London Metal Exchange on Wednesday. Prices eased again on Thursday (February 12), but remain well above 2025 averages.

                                    For more on what’s moving markets this week, check out our top market news round-up.

                                    Markets and commodities react

                                    Canadian equity markets were mixed this week.

                                    The S&P/TSX Composite Index (INDEXTSI:OSPTX) gained 2.88 percent over the week to close Friday (February 13) at 33,073.71, while the S&P/TSX Venture Composite Index (INDEXTSI:JX) shed 0.48 percent to 991.99.

                                    The CSE Composite Index (CSE:CSECOMP) dropped 2.7 percent to 163.24

                                    The gold price was largely flat, losing just 0.07 percent to close at US$5,032.68 per ounce on Friday at 4:00 p.m. EST. The silver price fared worse, closing the week down 8.43 percent at US$76.92 on Friday.

                                    In base metals, the Comex copper price recorded a 2.35 percent decrease this week to US$5.83.

                                    The S&P Goldman Sachs Commodities Index (INDEXSP:SPGSCI) was down 0.13 percent to end Friday at 583.86.

                                    Top Canadian mining stocks this week

                                    How did mining stocks perform against this backdrop?

                                    Take a look at this week’s five best-performing Canadian mining stocks below.

                                    Stocks data for this article was retrieved at 4:00 p.m. EST on Friday using TradingView’s stock screener. Only companies trading on the TSX, TSXV and CSE with market caps greater than C$10 million are included. Mineral companies within the non-energy minerals, energy minerals, process industry and producer manufacturing sectors were considered.

                                    1. Trinity One Metals (TSXV:TOM)

                                    Weekly gain: 104.55 percent
                                    Market cap: C$12.83 million
                                    Share price: C$0.45

                                    Trinity One Metals is a silver exploration and development company with a portfolio of mineral projects, including the recently acquired Silver 1 project in Ecuador.

                                    The property consists of the Silver-1 mine concession, which covers an area of 3,108 hectares and lies within the same mineral belt as Lundin Gold’s (TSX:LUG,OTCQX:LUGDF) Fruta Del Norte mine. Past mining at the site occurred between 1989 and 1994 and included 3,600 meters of underground development, along with a historic resource of 200,000 to 700,000 metric tons of ore averaging 400 to 800 grams per metric ton (g/t) silver and 3 g/t gold.

                                    The company announced the closing of the property acquisition on February 4 for a total consideration of US$540,000. In the release, the company said it will work swiftly to confirm the historic resource to modern standards.

                                    The news was followed on Tuesday (February 10), when the company announced a C$3.3 million non-brokered private placement, which was upsized to C$5.3 million on Thursday. The company said it will use proceeds from the placement to advance exploration projects across its portfolio.

                                    2. Cordoba Minerals (TSXV:CDB)

                                    Weekly gain: 74.68 percent
                                    Market cap: C$123.82 million
                                    Share price: C$1.38

                                    Cordoba Minerals is an explorer whose flagship project is Alacran in Colombia. The asset is a 50/50 joint venture with JCHX Mining Management (SHA:603979). The 20,000 hectare property hosts copper, gold and silver mineralization across five deposits: Alacran, Alacran North, Montiel East, Montiel West and Costa Azul.

                                    A feasibility study for the project released in February 2024 demonstrates an after-tax net present value of US$360 million with an internal rate of return of 23.8 percent and a payback period of three years.

                                    The resource estimate for the Alacran deposit and historical tailings shows an indicated resource of 99.46 million metric tons of ore with an average grade of 0.41 percent copper, 0.24 g/t gold and 2.65 g/t silver. Contained metal totals 904.53 million pounds of copper, 765,400 ounces of gold and 8.47 million ounces of silver.

                                    Following the completion of JCHX’s earn in for 50 percent of the project in July 2025, Cordoba said it had entered into a definitive agreement to sell its remaining 50 percent interest in Alacran.

                                    However, on January 2, the company reported that not all conditions for the sale had been met, and on Tuesday, announced that it had entered into an amended agreement.

                                    Under the new terms, the closing payment was increased to US$128 million from US$88 million, payable in a lump sum at closing. The release states that the bulk of the cash payment will be distributed to shareholders after settling liabilities and obligations, with the company retaining US$10 million for corporate purposes.

                                    3. Rio Silver (TSXV:RYO)

                                    Weekly gain: 52.38 percent
                                    Market cap: C$23.74 million
                                    Share price: C$0.64

                                    Rio Silver is an exploration company advancing its Maria Norte project in Peru.

                                    The property has changed hands several times in the 18 years prior to Rio’s acquisition in March 2025, but has seen little exploration during that time. However, in a February 5 release, the company notes that historic mining occurred at the site due to the presence of a reclaimed waste dump. The property covers the western portion of the Tangana West vein system, and although it has not yet completed an economic assessment for the property. In the announcement, the company said it plans to advance surface mapping and sampling in the third quarter of 2026.

                                    Throughout January, the company made several announcements regarding its exploration and development timeline. On January 6, the company reported results from technical work at the site, confirming the presence of silver mineralization with grades up to 991 g/t in a 0.7-meter channel sample.

                                    The company also announced on January 29 that it was launching a metallurgical program at the site, which it said will assist the company in determining the project’s potential value.

                                    4. Barksdale Resources (TSXV:BRO)

                                    Weekly gain: 48.15 percent
                                    Market cap: C$28.04 million
                                    Share price: C$0.2

                                    Barksdale Resources is a copper explorer focused on advancing its Sunnyside asset in Arizona, US. The property covers approximately 21 square kilometers, south of Tucson, Arizona. It hosts an intrusive complex that the firm believes to be an extension of the copper-zinc-lead-silver system found at South32’s (ASX:S32,OTCPL:SOUHY) Taylor deposit.

                                    In 2025, the company achieved several milestones under its earn-in agreement and completed the initial 51 percent in September following a C$1 million cash payment. Prior to the payment in June, Barksdale said it would work toward increasing its interest in the property to 67.5 percent.

                                    On January 21, the company announced plans to raise C$5 million to fund a Phase 2 drill plan required to increase its ownership stake in the Sunnyside project.

                                    On Wednesday, Barksdale announced the opening of an additional private placement to raise C$930,000. Funds raised from this round will also be used to fund exploration activities at Sunnyside.

                                    5. Pirate Gold (TSXV:YARR)

                                    Weekly gain: 48 percent
                                    Market cap: C$129.48 million
                                    Share price: C$0.37

                                    Formerly Sokoman Minerals, Pirate Gold is a discovery-oriented company with a portfolio of gold projects and one of the largest land positions in Newfoundland and Labrador, Canada.

                                    It also owns a 40 percent stake in the Killick lithium project, a 40/40/20 joint venture with Benton Resources (TSXV:BEX,OTCPL:BNTRF) and Piedmont Lithium.

                                    In October, the company combined its Moosehead and Crippleback claims to form the Treasure Island project, which hosts the largest mineral license and longest strike length along the Valentine Lake fault.

                                    Along with new claims, Pirate Gold’s land holdings in the area cover approximately 58,775 hectares and host multiple untested anomalies identified through historic data and exploration efforts by Pirate Gold.

                                    On Friday, Pirate Gold announced the initiation of project-scale surveys at Treasure Island, as well as the advancement of a 50,000 meter drill program, with two rigs mobilized to the site.

                                    Additionally, the company also said it had received drill permits to operate at the Crippleback Lake and Stony Lake areas, which would allow it to extend its exploration beyond the current footprint at Moosehead and test other high-priority targets along the fault zone.

                                    FAQs for Canadian mining stocks

                                    What is the difference between the TSX and TSXV?

                                    The TSX, or Toronto Stock Exchange, is used by senior companies with larger market caps, and the TSXV, or TSX Venture Exchange, is used by smaller-cap companies. Companies listed on the TSXV can graduate to the senior exchange.

                                    How many mining companies are listed on the TSX and TSXV?

                                    As of December 2025, 898 mining companies and 71 oil and gas companies are listed on the TSXV, combining for more than 60 percent of the 1,531 total companies listed on the exchange.

                                    As for the TSX, it is home to 175 mining companies and 51 oil and gas companies. The exchange has 2,089 companies listed on it in total.

                                    Together, the TSX and TSXV host around 40 percent of the world’s public mining companies.

                                    How much does it cost to list on the TSXV?

                                    There are a variety of different fees that companies must pay to list on the TSXV, and according to the exchange, they can vary based on the transaction’s nature and complexity. The listing fee alone will most likely cost between C$10,000 to C$70,000. Accounting and auditing fees could rack up between C$25,000 and C$100,000, while legal fees are expected to be over C$75,000 and an underwriters’ commission may hit up to 12 percent.

                                    The exchange lists a handful of other fees and expenses companies can expect, including but not limited to security commission and transfer agency fees, investor relations costs and director and officer liability insurance.

                                    These are all just for the initial listing, of course. There are ongoing expenses once companies are trading, such as sustaining fees and additional listing fees, plus the costs associated with filing regular reports.

                                    How do you trade on the TSXV?

                                    Investors can trade on the TSXV the way they would trade stocks on any exchange. This means they can use a stock broker or an individual investment account to buy and sell shares of TSXV-listed companies during the exchange’s trading hours.

                                    Article by Dean Belder; FAQs by Lauren Kelly.

                                    Securities Disclosure: I, Dean Belder, hold no direct investment interest in any company mentioned in this article.

                                    Securities Disclosure: I, Lauren Kelly, hold no direct investment interest in any company mentioned in this article.

                                    This post appeared first on investingnews.com

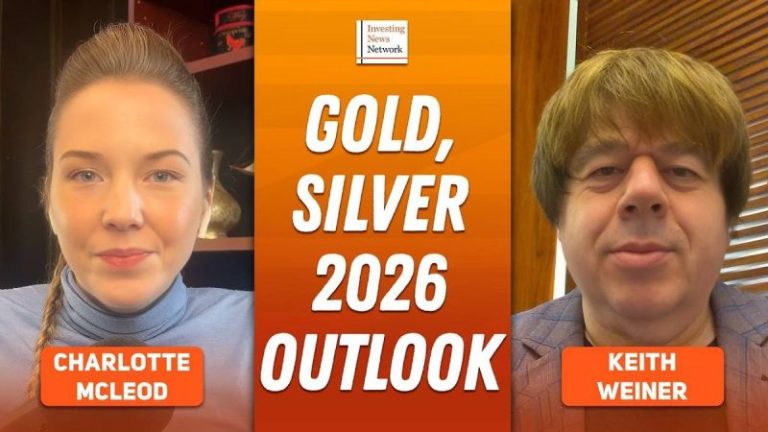
                                    Keith Weiner, founder and CEO of Monetary Metals, shares his outlook for gold and silver in 2026, saying that while he expects higher prices there will be volatility.

                                    He also outlines his thoughts on the role of precious metals in the monetary system.

                                    Securities Disclosure: I, Charlotte McLeod, hold no direct investment interest in any company mentioned in this article.

                                    This post appeared first on investingnews.com

                                    (TheNewswire)

                                    Toronto, Ontario TheNewswire – February 12, 2026 Homeland Nickel Inc. (‘Homeland’ or the ‘Company’) (TSX-V: SHL, OTC: SRCGF), announces that Noble Mineral Exploration Inc. (‘Noble’) (TSX-V: NOB, FRANKFURT: NB7, OTCQB.PK: NLPXF) has approved a distribution of 9,000,000 common shares of Homeland through a plan of arrangement.

                                    The share distribution, which is based pro rata on Noble shareholdings of Noble common shares, must be approved by Noble shareholders by way of a special shareholder meeting that is scheduled for May 7, 2026 for shareholders of record as of March 27, 2026. For more information see Noble’s new release (dated February 12, 2026).

                                    FOR FURTHER INFORMATION PLEASE CONTACT:

                                    Stephen Balch, President & CEO

                                    Phone:        905-407-9586

                                    Email:        steve@beci.ca


                                    About Homeland Nickel


                                    Homeland Nickel is a Canadian-based mineral exploration company focused on critical metal resources with nine nickel projects in Oregon, United States and copper and gold projects in Newfoundland, Canada. The Company holds a significant portfolio of mining securities including 442 thousand shares of Canada Nickel Company Inc. (TSX-V: CNC), 9.960 million shares of Noble Mineral Exploration Inc. (TSX-V: NOB), 11.447 million shares of Benton Resources Inc. (TSX-V: BEX), 81,150 shares of Vinland Lithium Inc. (TSX-V: VLD) and 2.761 million shares of Magna Terra Minerals Inc. (TSX-V: MTT). Homeland Nickel’s common shares trade on the TSX Venture Exchange under the symbol ‘SHL’. More detailed information can be found on the Company’s website at:

                                    http://www.homelandnickel.com 

                                    Cautionary Statement

                                    This news release may contain assumptions, estimates, and other forward-looking statements regarding future events. Such forward-looking statements involve inherent risks and uncertainties and are subject to factors, many of which are beyond the Company’s control that may cause actual results or performance to differ materially from those currently anticipated in such statements.

                                    Neither the TSX Venture Exchange nor its Regulation Services Provider (as that term is defined in the policies of the TSX Venture Exchange) accepts responsibility for the adequacy or accuracy of this release.


                                    Copyright (c) 2026 TheNewswire – All rights reserved.

                                    News Provided by TheNewsWire via QuoteMedia

                                    This post appeared first on investingnews.com
                                    Tajiri Resources Corp. (TSXV: TAJ) (‘Tajiri’ or the ‘Company’) is pleased to report results from its ongoing Phase II trenching program at the majority owned Yono Project, Guyana, which indicate three significant gold zones potentially hosting economic mineralisation. All results are given in Table 1 and locations of trenches and mineralised intersections are shown in Figure 1.

                                    *To View Full Presentation of Figures Associated with this announcement visit: https://tinyurl.com/TAJPR1202F

                                    Yono is contiguous with and surrounded by the Oko and Oko West Properties of TSX listed G2 Goldfields Inc. ‘G2’ & G Mining Ventures ‘GMIN’, which collectively host 6.9 Moz and 2.0 Moz of Indicated and Inferred Resources (~ 94Mt @ 2.3g/t Ind. & 26Mt @ 2.5g/t Inf)1 within 150-170m of Yono’s eastern boundary and extending north and south of Yono over a total distance of ~ 5km. Currently the Oko West Deposit of GMIN is in construction with production slated for Q1 2028.

                                    The three significant zones with potential to host economic gold mineralisation are as follows:

                                    • North ‘Tweener Zone – Carbonaceous Metasediment Contact

                                    A cluster of trench intersections – YTR16 20m @ 1.4g/t; YTR4R 12m @ 2.5g/t; YTR18 4m @ 1.8g/t & 4m @ 5.5g/t Gold situated on the northern boundary of Yono, which combined with mapping indicates a complex mineralised and folded contact zone between carbonaceous metasediments and a sequence of interbedded chloritic metasediments + volcanics (Figure 2). The zone strikes, dips and plunges southwards into Yono and is possibly an extension of the same mineralised contact encountered in YTR4, which returned 19m @ 4.6g/t Au2 400m south of the above-mentioned intersections (Figure 3). In addition, the Zone may strike southwards for ~ 800m before reaching the Projects boundary. Thus, a highly significant zone with substantial strike potential is indicated for immediate follow-up.

                                    • Ridgeline Splay ZoneDiorite Contact

                                    YTR8 intersected 18m @ 0.8g/t including 10m @ 1.1g/t Gold. Combined with geophysics, mapping, geochemical and trench assays, the intersection is highly significant because it reveals a gold mineralised contact between diorite and country rock that extends through Yono for a distance of ~ 1,200m (Figure 4). The geological setting is directly analogous to the large Ghanie and Oko West deposits which are hosted in the contact zone of the Ghanie Diorite and lie at their closest point ~150m from the Yono.

                                    • Eastern Border Zone

                                    YTR 15, located in the southeast corner of Yono intersected 18m @ 0.5g/t including 8m @ 1.0g/t Gold. Mapping indicates the zone has a similar strike to Ghanie and the northern part of the Oko West Deposits at ~ 10-15°. The zone strikes northwards along the eastern boundary of Yono for a distance of some ~ 700m through the previously reported intersection of 1m @ 10.8g/t Gold encountered in trench YTR7 and into a cluster of higher auger values including, 1.6g/t Gold further north, before being inferred to pass into the tenure of G2 (Figure 5).

                                    The implication of the zone is that it demonstrates the existence of potentially economic mineralisation west of, striking parallel to and near the Ghanie and Oko West deposits. To date, there has been a dearth of exploration within the tenure of both G2 and GMIN along the Yono border area despite there being abundant alluvial and bedrock artisanal workings indicating mineralised zones may exist in the footwall of the Ghanie Diorite within this area. The exploitation of any substantial mineralisation discovered, west of the Ghanie and Oko West deposits may require mining operations impinging onto Yono.

                                    • Others

                                    In addition to the above significant intersections trenches have also encountered substantial widths of gold anomalism ~10-26m @ ~ 0.1-0.2g/t Gold (Table 1 & Figure 1) which may be indicative of better mineralisation along strike or down dip of these anomalous zones (Figure 5). Such is supported by the style of mineralisation in the district where early trench results over the Oko West Deposit- 5.41Moz and 0.4M oz Indicated & Inferred Resources (80Mt @ 2.1g/t Ind. & 5.1Mt @ 2.4 Inf) show marked short range variation in widths and grades of mineralisation over strike lengths of ~100m (Figure 6).

                                    Exploration Progress

                                    Currently a 2,610m trenching program, targeting better auger anomalies is underway. To date, 1,800m has been completed. Field operations recommenced January 15. Currently an additional ~ 1,500m of trenching is being planned. Currently trenches to explore beyond YTR3, 3R, 16 & 17 are in progress.

                                    Trenching and mapping has identified ferricrete capping a large portion of Yono (Figure 5). As a result, the Company is evaluating power auger drilling and/or shallow RC drilling to effectively test gold anomalies beneath the ferricrete cap, which is typically strongly leached of gold.

                                    Executive Chairman, Dominic O’Sullivan, commented: ‘Our confidence in the potential for Yono to host significant economic gold mineralization continues to grow with each phase of results. The project now hosts at least three mineralized structural-stratigraphic corridors totalling approximately 3 km of strike length, each returning gold grades in excess of 1 g/t. Additional anomalous zones have also been identified that may develop into higher-grade mineralization along strike or at depth. Based on these results, the Company is accelerating its exploration programs and is in the process of hiring additional geological staff and mobilizing a second excavator to expedite trenching.’

                                    On Behalf of the Board,

                                    Tajiri Resources Corp.

                                    Graham Keevil,
                                    President & CEO

                                    About Tajiri Resources

                                    Tajiri Resources Corp. is a junior gold exploration and development Company with exploration assets located in the emerging premier gold destination of Guyana, South America. Lead by a team of industry professionals with a combined 100 plus years’ experience – 40 of that in Guyana; and a track record of discovering ~20 million ounces of gold in Western Australia, West Africa and Guyana- the Company’s goal is to generate the highest possible returns for shareholders through exploration and discovery.

                                    Contact Information:

                                    Tajiri Resources Corp.
                                    Graham Keevil
                                    President, CEO
                                    778-229-9602
                                    graham@tajirigold.com
                                    www.tajirigold.com

                                    Methodology

                                    Trenches were dug by a 25 tonne New Holland excavator, rented by the Company. Ground is first cleared and soil and laterite overburden is removed to a depth 2-4m in an upper bench. Thence the trench is dug to a total depth of 6-7m (2-3m below the upper bench) to reach underlying saprolite where possible.

                                    Sampling is routinely conducted as horizontal channels taken on the south side of the trench along the floor mostly as 2m continuous composites. The entire length of a trench is sampled and in areas of potential interest the sampling interval may be tailored to the interval of interest with sample intervals of 1m or less if required (e.g. YTR3 @ 80-80.3m). Trench walls are cleaned prior to channel sampling, preventing contamination from higher in the weathered profile. All trenches are sampled from west to east or from south to north and intervals reported herein are referenced from the western and southern end of trenches.

                                    Orientations and positions of all reported trenches and intersections are shown in Figure 1 together with the mineralised intervals referred to in the Table of significant intersections. Except for Trenches YTR6 and YTR7 all trenches were excavated in an east west orientation to cut inferred dominant north-south striking zones.

                                    Samples, weighing typically between 2-5kg, are bagged and labelled immediately after sampling and stored on site until transport to either Actlabs or MSA laboratories in Georgetown Guyana, respecting industry standard chain of custody procedures. At Actlabs samples are dried and crushed to 80% passing 2mm and a 250g aliquot is riffle split and pulverised and analysed by 50-gram fire assay. At MSA labs a 1,000-gram aliquot is pulverised. Initial assay readings are by atomic absorption with samples returning values greater than 3.0g/t being re-assayed with a gravimetric finish. The detection limit for both laboratories is 5ppb. The company inserts a QA/QC sample every 10th sample alternating between duplicates, blanks and standards. Bulk rejects and pulps are retained for 3 months for any required re-assay after which bulk rejects are discarded and pulps retained.

                                    Qualified Person

                                    The scientific and technical contents of this news release have been reviewed and approved by Dominic O’Sullivan B.Sc. and Executive Chairman of the Company. Mr. O’Sullivan is an Honours Graduate of the University of Sydney and a member of the AusIMM and a qualified person, as defined by National Instrument 43-101 – Standards of Disclosure for Mineral Projects.

                                    Forward-Looking Statements

                                    This news release contains ‘forward-looking information’ and ‘forward-looking statements’ (collectively, ‘forward-looking statements’) within the meaning of the applicable Canadian securities legislation. All statements, other than statements of historical fact, are forward- looking statements and are based on expectations, estimates and projections as at the date of this news release, including without limitation; estimated timing, obtaining the final approval of the TSXV, geological interpretations relating to the Yono Gold Property and potential mineral recovery processes or results. Any statement that involves discussions with respect to predictions, expectations, beliefs, plans, projections, objectives, assumptions, future events or performance (often but not always using phrases such as ‘expects’, or ‘does not expect’, ‘is expected’, ‘anticipates’ or ‘does not anticipate’, ‘plans’, ‘budget’, ‘scheduled’, ‘forecasts’, ‘estimates’, ‘believes’ or ‘intends’ or variations of such words and phrases or stating that certain actions, events or results ‘may’ or ‘could’, ‘would’, ‘might’ or ‘will’ be taken to occur or be achieved) are not statements of historical fact and may be forward-looking statements.

                                    Forward-looking statements contained herein are made as of the date of this press release, and the Company disclaims, other than as required by law, any obligation to update any forward-looking statements whether as a result of new information, results, future events, circumstances, or if management’s estimates or opinions should change, or otherwise. There can be no assurance that forward-looking statements will prove to be accurate, as actual results and future events could differ materially from those anticipated in such statements. Accordingly, the reader is cautioned not to place undue reliance on forward- looking statements.

                                    Neither the TSXV nor its Regulation Services Provider (as that term is defined in the policies of the TSXV) accepts responsibility for the adequacy and / or accuracy of this release.

                                    Table 1
                                    Significant Trench Intercepts

                                    Trench Total Length
                                    Metres
                                    From
                                    (m)
                                    To
                                    (m)
                                    Interval
                                    (m)
                                    Au
                                    g/t
                                    YTR3R 12 0 12 12 2.4
                                    incl 6 8 2 6.0
                                    YTR4X 100 0 12 12 0.2
                                    82 84 2 0.6
                                    YTR 8X 40 10 36 22 0.8
                                    Incl. 8 1.1
                                    YTR10 470 394 418 24 0.2
                                    446 456 10 0.2
                                    YTR15 160 114 132 18 0.5
                                    114 122 8 1.0
                                    YTR12 270 112 118 6 0.5
                                    214 218 4 0.7
                                    YTR16 20 0 20 20 1.4
                                    Incl. 6 8 2 7.3
                                    YTR17 22 NSR
                                    YTR18 22 0 4 4 1.8
                                    18 22 4 5.5
                                    YTR19 66 0 26 26 0.2

                                    Intercepts are reported with a maximum of 2m of internal dilution at a cutoff grade of 0.1g/t. Internal dilution of 2m has been applied to intercepts that average >1g/t and 6m to anomalous zones which average <1g/t. All intervals are given as the intersected widths and while strikes and dips of structures, contacts and veins associated with mineralised intervals have been measured during routine mapping of the trenches, given the early nature of exploration and the fact that vein orientations within shear zones commonly occupy an array or orientations often oblique to the true strike and width of a mineralised zones we cannot at this stage give a true width for the mineralised intervals given in the above table.

                                    End notes:

                                    The disclosure in this news release includes information on properties adjacent to Tajiri’s projects. Tajiri has no interest in or rights to acquire any interest in such adjacent properties, and the information presented is not necessarily indicative of the mineralization on the Yono Gold Property. The results from adjacent properties are disclosed strictly to provide context and should not be interpreted as suggesting that similar results will be obtained from the Yono Gold Property.

                                    Mineral Resources quantified for the neighbouring properties may be found on p17 and p1-14 respectively of the below referenced Technical Reports.

                                    Lewis W. J., Sarkar C., San Martin A.J. & Gowans R. (2025) NI 43-101 Technical Report for the 2025 Updated Mineral Resource Estimate for the Oko Gold Property in the Co-operative Republic of Guyana, South America, Effective Date March1, 2025; Report Date: April 24, 2025. Micon International; report prepared for G2 Goldfields Inc. https://g2goldfields.com/technical/

                                    Beaulieu C, Leahy K., Lincoln N., Burelle A., Guido S., Murphy P., Behrens da Franca P.R,. (2025) Feasibility Study NI43-101 Technical Report Oko West Project, Effective Date April 28, 2025, Issue Date June 06, 2025. G Mining Services; report prepared for G Mining Ventures. https://downloads.ctfassets.net/hdghwvgt3xim/42yNQ6zp8FAkSRXacGSzIk/86eacbd8f9c5798be50c098fc64097f1/GMIN_2025_OKO_WEST_FS_Technical_Report_43-101-_FINAL_WEBSITE.pdf

                                    Summary Resources Tabulated below,
                                    Combined both Open Pit and Underground Resources

                                    G2
                                    OMZ, Ghanie & Oko NW
                                    Tonnage Grade
                                    (g/t)
                                    Contained ounces
                                    (Millions of ounces)
                                    Total Indicated Resources 13,435,000 3.4 1.471
                                    Total Inferred Resources 20,511,000 2.5 1.635
                                    GMIN
                                    OKWD
                                    Total Indicated Resources 80,259,000 2.1 5.407
                                    Total Inferred Resources 5,127,000 2.4 0.39
                                    G2 & GMIN
                                    Combined
                                    Combined Total Indicated Res. 93,694,000 2.3 6.878
                                    Combined Total Inferred Res. 25,638,000 2.5 2.025

                                    1 See End Note for a breakdown of adjacent G2 and GMIN resources, and sources.
                                    2 See Tajiri News release of 17th Decemeber 2025 for details. Further descriptive details of the style of mineralisation in YTR16 are also given in the aforementioned News Release.

                                    Source

                                    This post appeared first on investingnews.com

                                    Rua Gold INC. (TSXV: RUA,OTC:NZAUF) (OTCQB: NZAUF) (‘Rua Gold’ or the ‘Company’) is pleased to announce that the Company will be uplisting to the Toronto Stock Exchange (the ‘TSX’). The common shares of the Company (the ‘Common Shares’) will be voluntarily delisted from the TSX Venture Exchange effective as of close of market on Friday, February 13, 2026, and will commence trading on the TSX effective at the opening of the market on Tuesday, February 17, 2026 under its current ticker symbol, ‘RUA’.

                                    Robert Eckford, CEO of Rua Gold, commented: ‘Graduating to the TSX is a significant milestone for Rua Gold. The uplisting will enhance our visibility in the capital markets and enable us to continue to attract key institutional and retail investors as we continue to develop the Reefton Project and Glamorgan Project in New Zealand.’

                                    Rua Gold will continue to remain a ‘reporting issuer’ under applicable Canadian securities laws, and the Common Shares will also remain listed on the OTCQB under the symbol ‘NZAUF’. Shareholders are not required to take any action in connection with the TSX uplisting.

                                    About Rua Gold

                                    Rua Gold is an exploration company, strategically focused on New Zealand. With decades of expertise, their team has successfully taken major discoveries into producing world-class mines across multiple continents. The team is focused on maximizing the asset potential of Rua Gold’s two highly prospective high-grade gold projects.

                                    The Company controls the Reefton Gold District as the dominant landholder in the Reefton Goldfield on New Zealand’s South Island with over 120,000 hectares of tenements, in a district that historically produced over 2Moz of gold grading between 9 and 50g/t.

                                    The Company’s Glamorgan Project solidifies Rua Gold’s position as a leading high-grade gold explorer on New Zealand’s North Island. This highly prospective project is located within the North Islands’ Hauraki district, a region that has produced an impressive 15Moz of gold and 60Moz of silver. Glamorgan is adjacent to OceanaGold Corporation’s biggest gold mining project, Wharekirauponga.

                                    FOR FURTHER INFORMATION PLEASE CONTACT:
                                    Robert Eckford
                                    Phone: (604) 655-7354
                                    Email: reckford@ruagold.com

                                    Neither the TSXV nor its Regulation Services Provider (as that term is defined in the policies of the TSXV) accepts responsibility for the adequacy or accuracy of this release.

                                    Forward-Looking Information

                                    This news release includes certain statements that may be deemed ‘forward-looking statements’. All statements in this news release, other than statements of historical facts, that address events or developments that the Company expects to occur, are forward-looking statements. Forward-looking statements are statements that are not historical facts and are generally, but not always, identified by the words ‘expects’, ‘plans’, ‘anticipates’, ‘believes’, ‘intends’, ‘estimates’, ‘projects’, ‘potential’ and similar expressions, or that events or conditions ‘will’, ‘would’, ‘may’, ‘could’ or ‘should’ occur and specifically include statements regarding: the Company’s strategies, expectations, planned operations or future actions including but not limited to exploration programs at its New Zealand properties; the intended listing date on the TSX and the delisting date on the TSX Venture Exchange. Although the Company believes the expectations expressed in such forward-looking statements are based on reasonable assumptions, such statements are not guarantees of future performance and actual results may differ materially from those in the forward-looking statements.

                                    Investors are cautioned that any such forward-looking statements are not guarantees of future performance and actual results or developments may differ materially from those projected in the forward-looking statements. A variety of inherent risks, uncertainties and factors, many of which are beyond the Company’s control, affect the operations, performance and results of the Company and its business, and could cause actual events or results to differ materially from estimated or anticipated events or results expressed or implied by forward looking statements. Some of these risks, uncertainties and factors include: general business, economic, competitive, political and social uncertainties; risks related to the effects of the Russia-Ukraine war; risks related to climate change; operational risks in exploration, delays or changes in plans with respect to exploration projects or capital expenditures; the actual results of current exploration activities; conclusions of economic evaluations; changes in project parameters as plans continue to be refined; changes in labour costs and other costs and expenses or equipment or processes to operate as anticipated, accidents, labour disputes and other risks of the mining industry, including but not limited to environmental hazards, flooding or unfavorable operating conditions and losses, insurrection or war, delays in obtaining governmental approvals or financing, and commodity prices. This list is not exhaustive of the factors that may affect any of the Company’s forward-looking statements and reference should also be made to the Company’s documents filed under its SEDAR+ profile at www.sedarplus.ca for a description of additional risk factors.

                                    Forward-looking statements are based on the beliefs, estimates and opinions of the Company’s management on the date the statements are made. Except as required by applicable securities laws, the Company undertakes no obligation to update these forward-looking statements in the event that management’s beliefs, estimates or opinions, or other factors, should change.

                                    To view the source version of this press release, please visit https://www.newsfilecorp.com/release/283786

                                    News Provided by TMX Newsfile via QuoteMedia

                                    This post appeared first on investingnews.com
                                    Copper Quest Exploration Inc. (CSE: CQX,OTC:IMIMF; OTCQB: IMIMF; FRA: 3MX) (‘Copper Quest’ or the ‘Company’) announces that it has entered into a securities for debt settlement agreement dated February 11, 2026 (the ‘Agreement’) with a professional advisor of the Company.

                                    Pursuant to the Agreement, the Company has agreed to settle debt in the amount of $113,405.28 through the issuance of 872,348 units (each, a ‘Unit‘) at a deemed price of $0.13 per Unit, whereby each Unit shall be comprised of one (1) common share in the capital of the Company (each a ‘Share‘) and one (1) Share purchase warrant (each whole, being a ‘Warrant‘). Each Warrant will be convertible into an additional Share (a ‘Warrant Share‘) at an exercise price of $0.165 per Warrant Share and will expire on the date that is two (2) years following the date of issuance (the ‘Expiry Date‘). The Expiry Date shall be subject to acceleration should the closing price of the Shares on the Canadian Securities Exchange (or any such other stock exchange in Canada as the Shares may trade at the applicable time) equal or exceed $0.50 for ten (10) consecutive trading days at any time from the date which is 4 months following their date of issue, the Company may accelerate the expiry date of the Warrants such that the Warrants shall expire on the date which is 30 calendar days following the date a news release is issued by the Company announcing the accelerated expiry date of the Warrants.

                                    The Agreement and the issuance of the securities thereunder are subject to the approval of the CSE. The securities will be subject to a hold period of four months and one day pursuant to CSE policies and applicable securities laws.

                                    About Copper Quest

                                    The company’s land holdings comprise 7 projects that span over 45,000 hectares in great mining jurisdictions of Canada and the USA. Copper Quest is committed to building shareholder value through acquisitions, discovery-driven exploration, and responsible development of its North American critical mineral portfolio of assets. The Company’s common shares are principally listed on the Canadian Stock Exchange under the symbol ‘CQX’. For more information on Copper Quest, please visit the Company’s website at www.copper.quest.

                                    Copper Quest has a 100% interest in the past-producing Alpine Gold Mine located approximately 20 kilometers northeast of the City of Nelson British Columbia, spanning 4,611.49 hectares with a 2018 National Instrument 43-101 Standards of Disclosure for Mineral Projects historical inferred resource of 268,000 tonnes, estimated using a cut-off grade of 5.0 g/t Au and an average grade of 16.52 g/t Au, that represents an inferred resource of 142,000 oz of gold (McCuaig & Giroux, 2018)*. Apart from the Alpine Mine itself the property hosts 4 other less explored significant vein systems including the past-producing King Solomon vein workings, the Black Prince and the Cold Blow veins system, and the Gold Crown vein system. *The Company has not yet completed sufficient work to verify the 2018 historic inferred resource results.

                                    Copper Quest has a 100% interest in the road accessible Stars Porphyry Copper-Molybdenum Property, spanning 9,693 hectares in central British Columbia’s Bulkley Porphyry Belt with Tana Zone discovery drill intersection highlights of 0.466% Cu over 195.07m* in drill hole DD18SS004 from 23.47m, 0.200% Cu over 396.67m* in drill hole DD18SS010 from 29.37m, and 0.205% Cu over 207.27m* in drill hole DD18SS015 from 163.98m. This highly prospective, approximately 5 X 2.5 kilometer annular magnetic anomaly is interpreted to represent an altered monzonite intrusion and surrounding hornfels.

                                    Copper Quest has a 100% interest in the road accessible Kitimat Copper-Gold Property, spanning 2,954 hectares within the Skeena Mining Division of northwestern British Columbia located northwest of the deep-water port community of Kitimat, British Columbia. The property benefits from exceptional infrastructure, being within 10 km of tidewater, 1.5 km of rail, and 6 km of high-voltage hydroelectric transmission lines. Exploration on the Kitimat property dates to the late 1960s, with the most significant historical work conducted by Decade Resources Ltd. (2010), which completed 16 diamond drill holes totaling 4,437.5 meters in the Jeannette Cu-Au Zone, and drill intersection highlights of 1.03 g/t Au, 0.54% Cu over 117.07 m in Hole J-7 from 1.52 m, 1.00 g/t Au, 0.55% Cu over 103.65m in Hole J-1 from 9.15 m, 0.80 g/t Au, 0.45% Cu over 107.01m in Hole J-2 from 6.10 m, and 0.41 g/t Au, 0.33% Cu over 112.20m in Hole J-8 from 11.89 m.

                                    Copper Quest has a 100% interest in the Nekash Copper-Gold Project, a porphyry exploration opportunity located in Lemhi County, Idaho, USA, along the prolific Idaho-Montana porphyry copper belt that hosts world-class systems such as Butte and CUMO. The project is fully road-accessible via maintained U.S. highways and forest service roads and consists of 70 unpatented federal lode claims covering 585 hectares.

                                    Copper Quest has a 100% interest in the road accessible Stellar Property, spanning 5,389-hectares in British Columbia’s Bulkley Porphyry Belt contiguous to the Stars Property.

                                    Copper Quest has a 100% interest in the Thane Project located in the Quesnel Terrane of Northern British Columbia spanning over 20,658 hectares with 10 priority targets identified demonstrating significant copper and precious metal mineralization potential.

                                    Copper Quest has an earn-in option of up to 80% and joint-venture agreement on the road accessible Rip Porphyry Copper-Molybdenum Project, spanning 4,700-hectares located in the Bulkley Porphyry Belt in central British Columbia.

                                    On behalf of the Board of Copper Quest Exploration Inc.

                                    Brian Thurston, P.Geo.
                                    Chief Executive Officer and Director
                                    Tel: 778-949-1829

                                    For further information contact:
                                    Investor Relations
                                    info@copper.quest

                                    https://x.com/CSECQX
                                    https://ca.linkedin.com/company/copper-quest

                                    Forward Looking Information

                                    This news release contains certain ‘forward-looking information’ and ‘forward-looking statements’ (collectively, ‘forward-looking statements‘) within the meaning of applicable securities legislation. All statements, other than statements of historical fact included herein, including without limitation, future operations and activities of Copper Quest, are forward-looking statements. Forward-looking statements are frequently, but not always, identified by words such as ‘expects’, ‘anticipates’, ‘believes’, ‘intends’, ‘estimates’, ‘potential’, ‘possible’, and similar expressions, or statements that events, conditions, or results ‘will’, ‘may’, ‘could’, or ‘should’ occur or be achieved. Forward-looking statements reflect the beliefs, opinions and projections on the date the statements are made and are based upon a number of assumptions and estimates based on or related to many of these factors. Such factors include, without limitation, risks associated with possible accidents and other risks associated with mineral exploration operations, the risk that the Company will encounter unanticipated geological factors, risks associated with the interpretation of exploration results, the possibility that the Company may not be able to secure permitting and other governmental clearances necessary to carry out the Company’s exploration plans, the risk that the Company will not be able to raise sufficient funds to carry out its business plans, and the risk of political uncertainties and regulatory or legal changes that might interfere with the Company’s business and prospects. Readers should not place undue reliance on the forward-looking statements and information contained in this news release concerning these items. The Company does not assume any obligation to update the forward-looking statements of beliefs, opinions, projections, or other factors, should they change, except as required by applicable securities laws.

                                    The Canadian Securities Exchange has not reviewed, approved or disapproved the contents of this press release, and does not accept responsibility for the adequacy or accuracy of this release.

                                    News Provided by GlobeNewswire via QuoteMedia

                                    This post appeared first on investingnews.com
                                    Latvian startup Deep Space Energy announced it has raised approximately US$1.1 million in a combination of private investment and public funding to advance a radioisotope-based power generator designed to operate on the Moon.

                                    The company closed a US$416,500 pre-seed round led by Outlast Fund and angel investor Linas Sargautis, a former co-founder of NanoAvionics. It also secured an additional US$690,200 in public contracts and grants from the European Space Agency (ESA), NATO’s Defense Innovation Accelerator for the North Atlantic (DIANA), and the Latvian government.

                                    Deep Space Energy is building a compact power system that uses radioisotopes, which are materials derived from nuclear waste that generate heat through natural decay, to produce electricity.

                                    Founder and CEO Mihails Ščepanskis said the system converts that heat into electrical power while using significantly less fuel than conventional radioisotope thermoelectric generators (RTGs) currently deployed in space.

                                    “Our technology, which has already been validated in the laboratory, has several applications across the defense and space sectors.

                                    “First, we’re developing an auxiliary energy source to enhance the resilience of strategic satellites. It provides the redundancy of satellite power systems by supplying backup power that does not depend on solar energy, making it crucial for high-value military reconnaissance assets,” Ščepanskis said.

                                    The company emphasized that the generator is not designed for weapons applications. Instead, it is targeting dual-use satellites operating in Medium Earth Orbit (MEO), Geostationary Orbit (GEO) and Highly Elliptical Orbit (HEO), all of which focus on communications, early warning systems, and reconnaissance capabilities.

                                    These satellites support defense functions including synthetic aperture radar for detecting troop movements, signal intelligence systems, and missile-launch detection platforms.

                                    According to Ščepanskis, recent geopolitical events have underscored their importance.

                                    The war in Ukraine demonstrated the decisive role of satellite-based reconnaissance data. In 2025, Ukraine lost its beachhead in Russia’s Kursk Oblast during a period when the US temporarily halted the sharing of satellite intelligence.

                                    “As Europe is trying to become more independent, it is imperative to produce satellites with advanced capabilities on our own. Our technology provides an auxiliary energy source for satellites, which makes them more resilient to non-kinetic attacks and malfunctions,” he added.

                                    Beyond defense, Deep Space Energy is positioning its technology for lunar exploration. The company says its generator could support upcoming programmes such as NASA and ESA’s Artemis and Argonaut initiatives, as well as future lunar rover missions and the Moon Village framework.

                                    On the Moon, temperatures can fall below minus 150 degrees Celsius during night cycles that last roughly 354 hours, making solar power unreliable.

                                    Deep Space Energy estimates that about two kilograms of Americium-241 could generate 50 watts of power for a rover, compared with around 10 kilograms required by legacy RTG systems for similar output.

                                    By reducing fuel requirements, the company argues it could extend rover lifetimes across multiple lunar day-night cycles, potentially lasting years.

                                    Securities Disclosure: I, Giann Liguid, hold no direct investment interest in any company mentioned in this article.

                                    This post appeared first on investingnews.com

                                    As organizers award the medals for the Milan Cortina 2026 Winter Olympics, fans and spectators alike may have pondered a singular question at some point: how much is an Olympic gold medal actually worth?

                                    The short answer is far less—and far more—than most people assume.

                                    How is an Olympic gold medal made, and what is it worth?

                                    Despite the name, Olympic gold medals are not made of solid gold. Under International Olympic Committee rules, they are primarily composed of silver and plated with a thin layer of gold.

                                    Still, with gold prices now hovering at historic highs, even the thin coating carries more value than it once did.

                                    Using the official size and weight specifications for the Milan Cortina 2026 medals, precious metals firm Dillon Gage calculated what a gold medal would be worth if it were cast entirely in solid gold.

                                    Each Milan Cortina medal measures 80 millimeters in diameter and 10 millimeters thick. Based on those dimensions, Dillon Gage estimates a medal of that size would have a volume of approximately 47.6 cubic centimeters and would contain about 919 grams of gold if produced entirely from the metal.

                                    At the current spot gold price of US$5,061.45 per troy ounce, that equates to roughly US$149,600 in intrinsic metal value alone, all before factoring in craftsmanship or symbolism.

                                    But this is a hypothetical scenario. The actual gold medal that will hang around an athlete’s neck in Italy will contain 500 grams of .999 fine silver and just 6 grams of .9999 gold plating.

                                    Using current spot prices of gold at US$5,061.45 per troy ounce and silver at US$87.00 per troy ounce, the combined intrinsic metal value of a 2026 Olympic gold medal comes to approximately US$2,375.

                                    A silver medal, made of 500 grams of .999 silver, carries a metal value of about US$1,402 at today’s prices.

                                    A bronze medal, composed of 420 grams of copper priced at roughly US$5.90 per pound, has a melt value of about US$5.46.

                                    “The value of gold medals is a curious inquiry we receive, especially around the time of the Olympics,” said Terry Hanlon, president of Dillon Gage Metals. “It’s one of the most recognizable medals in the world, so it’s natural for people to wonder what it’s made of and what it’s actually worth. While Olympic gold medals are not solid gold, the silver content alone carries far more value today than it did just a few years ago, reflecting how much precious-metal markets have changed.”

                                    The medals themselves were designed by a multidisciplinary team led by Raffaella Paniè and produced by the Italian State Mint and Polygraphic Institute (IPZS). Their split-surface design symbolizes the union of Milan and Cortina, as well as the shared effort behind every Olympic achievement.

                                    Precious metals on the rise

                                    Still, as eye-catching as the design may be, the math behind the medals offers a telling snapshot of today’s precious metals market.

                                    When the Paris 2024 Olympic medals were unveiled two years ago, gold was trading around US$2,400 per troy ounce. At that time, the intrinsic metal value of a gold medal was under US$1,000.

                                    Today, gold prices have more than doubled. The theoretical value of a solid-gold Milan Cortina medal now approaches US$150,000, and even the thin six-gram plating layer carries over US$975 in gold value alone.

                                    The surge reflects broader trends in global markets where gold has rallied amid inflation concerns, geopolitical tensions, and rising investor demand for safe-haven assets.

                                    Silver has also strengthened, contributing significantly to the base value of Olympic medals that are largely silver by weight.

                                    But what is it really worth?

                                    Yet despite the fun computation experiment, their actual worth undeniably lies elsewhere: the years of training, the sacrifices, the split-second finishes, and the history attached to standing atop a podium as the world watches.

                                    By the time the flame is lit in Milan and Cortina, more than 5,000 athletes will compete for a place in Olympic history.

                                    While its actual value will technically be worth a few thousand dollars in weight, for the world-class athletes showcasing their prowess, each medal is priceless in their own right.

                                    No matter how high gold prices climb, the opportunity to win on the Olympic stage remains beyond calculation.

                                    Securities Disclosure: I, Giann Liguid, hold no direct investment interest in any company mentioned in this article.

                                    This post appeared first on investingnews.com

                                    New Frontier Minerals Ltd (LSE and ASX: NFM) is pleased to announce that it has entered into a binding option and earn-in agreement providing NFM with the right to acquire a majority (90%) interest in the Pomme REE Project from Australian-listed company Metallium (ASX: MTM), which is located approximately 500 km northwest of Montréal in Québec around 100 km from the service town of Lebel-sur-Quévillon. The Pomme Project consists of 43 mineral claims, covering 2,400 ha. NFM holds the exclusive and binding option to acquire 90% of the Pomme REE-Nb project.

                                    Highlights

                                    • Binding option and staged earn-in agreement executed to acquire 90% of the Pomme Project, which is a large carbonatite-hosted Rare Earth Element (REE) and Niobium (Nb) Project in Québec
                                    • Strategic alignment and acquisition from Metallium Limited (ASX: MTM) deepens the Harts Range vertical integration1 and adds a complementary Canadian asset to create a western world jurisdictional partnership
                                    • Metallium to assist as processing and technology partner, supporting metallurgical test work and downstream development
                                    • Initial activities will target conventional metallurgical studies work and Flash Joule Heating (FJH) test work on existing drill samples to assess the potential for upgrading REE mineralisation
                                    • Limited wide spaced scout drilling undertaken to date with high grade known mineralisation and large areas remaining untested from reconnaissance drilling
                                    • Pomme REE Carbonatite key historical intercepts2,8 include:
                                      • Drillhole POM-23-03: 398m @ 0.54% TREO & 0.05% Nb2O5 from 16m, including:
                                        • 30.5m @ 1.13% TREO & 0.03% Nb2O5 (from 311.5m) including
                                          • 26.5m @ 1.45% TREO & 0.02% Nb2O5
                                        • 51m @ 0.92% TREO & 0.06% Nb2O5 (from 216m) including
                                          • 9m @ 1.21% TREO & 0.03% Nb2O5 and
                                          • 8.5m @ 1.62% TREO & 0.03% Nb2O5
                                        • 36m @ 0.92% TREO & 0.06% Nb2O5 (from 174m) including
                                          • 18m @ 1.16% TREO & 0.03% Nb2O5
                                      • Drillhole POM-23-01: 513m @ 0.33% TREO & 0.08% Nb2O5 from 32m, including:
                                        • 17.5m @ 0.68% TREO & 0.08% Nb2O5 (from 228.6m) including
                                          • 7.6m @ 0.9% TREO & 0.02% Nb2O5, and
                                      • 94.8m @ 0.55% TREO & 0.05% Nb2O5 (from 333.5m) including
                                        • 4.5m @ 1% TREO & 0.02% Nb2O5, and
                                        • 4.9m @ 1.1% TREO & 0.02% Nb2O5, and
                                        • 4.25m @ 1.28% TREO & 0.02% Nb2O5, and
                                        • 17m @ 0.72% TREO & 0.06% Nb2O5
                                    • The project comprises easily accessible claims via logging roads, has access to hydro-electric power, relatively flat topography, and is supported by extensive mining infrastructure and services2
                                    • Low cost upfront consideration A$100,000 cash and A$200,000 in shares with contingent payments to earn a majority project interest through staged investment and technical milestones
                                    • Government support and existing arrangements with local Cree First Nations of Waswanipi (CFNW) community2
                                    • NFM (OTCQB:NFMXF) has engaged New York-based Viriathus Investor Advisory to expand its profile and actively promote the Company to US investors and capital markets

                                    Chairman Gerrard Hall commented: ‘This transaction materially advances NFM’s critical minerals strategy. Pomme is a large, carbonatite-hosted REE system in a proven Québec district, with historical drilling having already confirmed scale and continuity. The earn-in structure provides a capital-efficient pathway for growth, while early integration of Metallium as processing and technology partner further enhances the opportunity. The Board believes Pomme’s scale, location and upside strongly position NFM to deliver meaningful shareholder value.’

                                    John Hannaford, Chairman of Metallium, said: ‘We are delighted to partner with NFM in advancing and unlocking the full potential of the Pomme rare earths project. New Frontier brings strong exploration capability and a disciplined, value-driven approach to discovery, which we believe can materially enhance the scale and quality of the mineralised system. When combined with Metallium’s proprietary processing technologies and a comprehensive metallurgical test-work program, this partnership has the potential to support value uplift across both the resource and downstream development pathways.’

                                    POMME CARBONATITE REE PROJECT

                                    The Project is located approximately 500 km northwest of Montréal in Québec, around 100 km from the service town of Lebel-sur-Quévillon, approximately 50 km west of the Waswanipi Cree First Nation community, and benefits from easy access via established logging roads (Figure 1)2. The Project comprises 43 mineral claims, covering approximately 2,400 ha area and is located 7km from the world class Montviel Deposit, which has a total Indicated and Inferred resource of 266 Mt @ 1.46% TREO and 0.14% Nb2O5.

                                    Figure 1: Regional location map showing Pomme Project, in Québec, Canada2

                                    MTM Critical Metals (a 100% subsidiary of ASX:MTM) has completed a 13-hole diamond drilling program totalling approximately 5,718 metres at its Pomme Rare Earth Element and Niobium Project in Québec, Canada2. Carbonatite-hosted REE-Nb mineralisation was intersected in every drill hole, confirming the presence of a large, laterally extensive mineralised system exceeding 2 km² that remains open at depth (Figure 2).

                                    The historic work program has significantly advanced the geological understanding of the complex, with early interpretations indicating that higher-grade mineralisation occurs within a ring structure surrounding a magnetic ultramafic carbonatite core.

                                    Drill holes POM-23-03, POM 23-01 and POM 23-07 to the southwest of the mineralised carbonatite returned broad mineralised intervals with multiple high-grade TREO intersections, supporting strong geological similarities to the nearby world-class Montviel carbonatite deposit.

                                    Importantly, large portions of this prospective ring structure remain untested due to the broad drill spacing, presenting clear potential for further discovery through follow-up drilling.

                                    Figure 2: MTM scout drilling at the Pomme Project area overlain on airborne magnetic image (TMI, 1VD)

                                    STRATEGY AND DEVELOPMENT OPPORTUNITY

                                    The Pomme Project provides NFM with a highly capital-efficient, low-risk entry into a strategically located Canadian rare earth asset via a two-year option structure requiring upfront consideration of A$100,000 in cash and A$200,000 in NFM shares and minimum annual expenditure of A$100,000 per annum during the option period. This staged earn-in framework enables NFM to progressively earn a majority (90%) interest through defined technical and investment milestones, significantly limiting upfront capital exposure while preserving substantial upside.

                                    1. Initial work programs will focus on conventional metallurgical test work alongside the application of Metallium’s proprietary Flash Joule Heating (FJH) technology to existing drill core, targeting the production of upgraded rare earth concentrates and early validation of a scalable, low-cost processing pathway that has the potential to materially enhance project economics.
                                    2. The Pomme Project presents compelling exploration upside, having been subject to only limited, widely spaced drilling to date, with drill lines approximately 500 metres apart2. Despite this early-stage drill density, high-grade rare earth element intersections have already been identified within a large, laterally extensive carbonatite system, highlighting the potential for significant growth through follow-up drilling targeting near surface higher grade zones of rare earth mineralistion.

                                    The existing results indicate that higher-grade zones of mineralisation remain open, providing New Frontier Minerals with a strong opportunity to materially expand the scale and grade of mineralisation through systematic infill and step-out drilling programs.

                                    METALLIUM TECHNOLOGY PARTNERSHIP

                                    The acquisition deepens the Harts Range vertical integration with MTM1, adds a highly complementary Canadian asset, and creates a compelling Western-world partnership with MTM across Australia and Canada, delivering value for shareholders.

                                    NFM’s binding commercial framework with Metallium also establishes a strategic technology partnership that is directly applicable to the advancement of the Pomme REE-Nb Project in Québec. Under this framework, MTM’s proprietary Flash Joule Heating (FJH) technology has demonstrated encouraging sighter beneficiation results on raw rare earth ore, producing high-grade, Dy/Tb-rich concentrates without conventional flotation, acid leaching or reagent-intensive processing.

                                    The REE concentration enhancement and impurity rejection results observed through the aforementioned FJH test work indicate potential to support alternative downstream processing pathways for carbonatite-hosted rare earth projects such as Pomme, compared to conventional techniques. Alignment with MTM provides NFM with early integration of advanced metallurgical test work, access to MTM’s Texas Technology Campus for testing, and a clear potential pathway to Western-aligned rare earth supply chains, including U.S. magnet and defence markets, reinforcing the strategic value of the Pomme Project within a vertically integrated rare earth development strategy.

                                    NEXT STEPS

                                    Preliminary metallurgical test work

                                    Selection of diamond drill core for characterisation tests and accelerate metallurgical assessment on existing diamond core samples, utilising conventional metallurgical test work and tailored MTM Flash Joule Heating (FJH) processing technology to beneficiate and upgrade REE sample.

                                    Model geology, drilling and target high-grade mineralisation

                                    Integration of geological logging, assay results and geophysics into 3D model and identification of continuous higher grade zones for follow-up drilling.

                                    OPTION AND EARN-IN TERMS

                                    The Pomme Project consists of 43 mineral claims, covering 2,400 ha. New Frontier Minerals holds the exclusive and binding option to acquire 90% of the Pomme REE-Nb project from Metallium.

                                    Key Terms Summary – Pomme Rare Earth Project Option & Earn up to 90% interest in the project tenements from Metallium Ltd (via its option to acquire 100% of Critical Element Exploration Pty Ltd, holder of the GeoMega option).

                                    Option Terms and Earn-in Terms

                                    Option Fee:

                                    • A$100,000 cash (A$50,000 already paid as an exclusivity deposit)
                                    • A$200,000 in NFM shares, (issued at 5-day VWAP, 6-months escrow)
                                    • Option Period: Commences on access to historic drill samples for 24-month duration with exclusive rights to manage exploration and technical work during the option period

                                    Stage 1 – Option Exercise (Initial Earn-In)

                                    Upon exercise of the option at any time during the Option Period (subject to conditions precedent), NFM must pay the following option exercise fee:

                                    • Cash: A$150,000
                                    • Equity: A$200,000 in NFM shares (20-day VWAP, 6-month escrow)Result: Entry into Joint Venture and commencement of staged earn-in
                                    • Minimum annual expenditure of A$100,000 per annum

                                    Exercise of the Option is conditional upon the satisfaction (or waiver as applicable) of the following conditions precedent:

                                    • Due diligence: completion of financial, legal and technical due diligence on the Tenements, to the absolute satisfaction of NFM;
                                    • Third party approvals: the Parties obtaining all third party approvals and consents, necessary to lawfully complete the matters set out in this Agreement;
                                    • Deeds of assignment and assumption: MTM, NFM executing a deed of assignment and assumption in relation to all material agreements;
                                    • Joint Venture Agreement: the Parties entering into a definitive Joint Venture Agreement consistent with the terms and conditions set out in the binding Agreement;
                                    • MTM and/ or its subsidiaries being the 100% legal and beneficial owner of the Tenements; and
                                    • Technology Licence Agreement: MTM and NFM entering into a definitive Technology Licence Agreement consistent with the terms and conditions set out in the binding Agreement;
                                    • (together, the Conditions Precedent).

                                    Stage 2 – JORC Resource Milestone (within 3 years)

                                    • Minimum Spend: A$2.0 million
                                    • Interest Earned: 80% project interest
                                    • Milestone Payment: A$250,000 cash and A$250,000 in NFM shares (20-day VWAP, 6-month escrow) upon earning an 80% interest

                                    Stage 3 – Pre-Feasibility Study Milestone (within 5 years)

                                    • Minimum Spend: A$3.0 million
                                    • Interest Earned: 90% project interest
                                    • Milestone Payment: A$250,000 cash and A$250,000 in NFM shares (20-day VWAP, 6-month escrow) upon earning a 90% interest

                                    Residual Interest & FJH Royalty

                                    • Vendor retains 10% free-carried interest to DFS
                                    • If diluted below 10%, interest converts to a 1.5% NSR royalty on material processed through Metallium’s FJH facility
                                    • Existing third-party royalties (GeoMega/Niogold) remain in place

                                    Technology Alignment

                                    • Metallium retains ownership of its Flash Joule Heating (FJH) processing technology
                                    • Parties may enter into a separate technology licence agreement, including per-tonne fees, annual licence fees, and royalties (commercial terms to be negotiated)

                                    About New Frontier Minerals

                                    New Frontier Minerals Limited is an Australian-based focussed explorer, with a strategy to develop multi-commodity assets that demonstrate future potential as an economic mining operation. Through the application of disciplined and structured exploration, New Frontier has identified assets deemed core and is actively progressing these interests up the value curve. Current focus will be on advancing exploration activity at the Harts Range Niobium, Uranium and Heavy Rare Earths Project which is circa 140km north-east from Alice Springs in the Northern Territory.

                                    Other interests include the NWQ Copper Project, situated in the copper-belt district circa 150km north of Mt Isa in Queensland.

                                    New Frontier Minerals is listed on the LSE and ASX under the ticker ‘NFM’.

                                    Competent Persons Statement

                                    The scientific and technical information in this announcement, which relates to exploration results, preliminary sequential metallurgical results and the geology of the deposits described, is based on information compiled and approved for release by Mark Biggs. Mark Biggs is a Member of The Australasian Institute of Mining and Metallurgy (AusIMM Member # 107188) and meets the requirements of a Competent Person as defined by the 2012 Edition of the Australasian Code for Reporting of Exploration Results, Mineral Resources and Ore Reserves (JORC Code 2012 Edition). Mark Biggs has 35 years of experience relevant to Rare Earth Elements (REE), industrial mineral copper mineralisation types, as well as expertise in the quality and potential mining methods of the deposits under consideration. Additionally, he has 25 years of experience in the estimation, assessment, and evaluation of exploration results and mineral resource estimates, which are the activities for which he accepts responsibility. He also successfully completed an AusIMM Online Course Certificate in 2012 JORC Code Reporting. Mark Biggs is a consultant with ROM Resources and was engaged by New Frontier Minerals Limited to prepare the documentation for several prospects, specifically those within the Harts Range Prospects upon which the Report is based.

                                    Furthermore, the full nature of the relationship between himself and New Frontier Minerals Limited has been disclosed, including any potential conflicts of interest. Mark Biggs is a director of ROM Resources, a company that is a shareholder of New Frontier Minerals Limited, and ROM Resources provides occasional geological consultancy services to New Frontier Minerals Limited. The Report or excerpts referenced in this statement have been reviewed, ensuring that they are based on and accurately reflect, in both form and context, the supporting documentation relating to exploration results and any mineral resource estimates. The release of the Report and this statement has been consented to by the Directors of New Frontier Minerals Limited. Mr Biggs consents to the inclusion in this announcement of the matters based on his information and supporting documents in the form and context in which it appears.

                                    Forward Looking Statements

                                    Certain information in this document refers to the intentions of New Frontier Minerals Ltd, but these are not intended to be forecasts, forward-looking statements, or statements about future matters for the purposes of the Corporations Act or any other applicable law. The occurrence of events in the future is subject to risks, uncertainties and other factors that may cause New Frontier Minerals Ltd’s actual results, performance, or achievements to differ from those referred to in this announcement. Accordingly, New Frontier Minerals Ltd, its directors, officers, employees, and agents, do not give any assurance or guarantee that the occurrence of the events referred to in this announcement will occur as contemplated. The interpretations and conclusions reached in this announcement are based on current geological theory and the best evidence available to the authors at the time of writing. It is the nature of all scientific conclusions that they are founded on an assessment of probabilities and, however high these probabilities might be, they make no claim for complete certainty. Any economic decisions that might be taken based on interpretations or conclusions contained in this announcement will therefore carry an element of risk. The announcement may contain forward-looking statements that involve several risks and uncertainties. These risks include but are not limited to, economic conditions, stock market fluctuations, commodity demand and price movements, access to infrastructure, timing of approvals, regulatory risks, operational risks, reliance on key personnel, Ore Reserve and Mineral Resource estimates, native title, foreign currency fluctuations, exploration risks, mining development, construction, and commissioning risk. These forward-looking statements are expressed in good faith and believed to have a reasonable basis. These statements reflect current expectations, intentions or strategies regarding the future and assumptions based on currently available information. Should one or more of the risks or uncertainties materialise, or should underlying assumptions prove incorrect, actual results may vary from the expectations, intentions and strategies described in this announcement. No obligation is assumed to update forward-looking statements if these beliefs, opinions, and estimates should change or to reflect other future developments.

                                    Source

                                    This post appeared first on investingnews.com