
Author

admin

Browsing

Even with a few short-lived roller coaster rides, the stock market had a strong week. Though there was some selling on Friday, the S&P 500 ($SPX) and Nasdaq Composite ($COMPQ) closed up over the week as a whole, while the Dow Jones Industrial Average ($INDU) closed lower by 0.07%.

Earnings season has started on a positive note, with big banks and Netflix, Inc. (NFLX) reporting better-than-expected earnings. Inflation remains relatively tame and the labor market remains resilient. This has helped fuel the stock market’s higher trajectory, with sectors such as Technology, Industrials, and Financials showing strong upward moves.  Even small-caps are hanging in there, although they have pulled back a bit.

This price action supports broad participation in the market. The S&P 500 Equal-Weighted Index ($SPXEW) is also holding strong, trading above its 20-day exponential moving average. This tells us that participation isn’t limited to a handful of giants.

A Look Under the Hood

Overall growth still takes center stage and, so far, July is following its seasonality pattern. The seasonality chart below shows that in the last 10 years, the return in July was positive every year, with an average gain of 3.30%.

FIGURE 1. SEASONALITY CHART OF THE S&P 500. July is a strong month for the index, but August, September, and October paint a different picture.Image source: StockCharts.com. For educational purposes.

Switching to a same-scale line chart (with a few years removed for clarity) you can see that even in 2020 and 2022, when the S&P 500 was in negative territory, July was still a strong month.

FIGURE 2. SAME-SCALE SEASONALITY CHART FOR S&P 500 FROM 2016 TO 2025. July is a strong month for stocks, although some years the latter part of the month has seen a decline.Image source: StockCharts.com. For educational purposes.

Seasonality shifts notably as we move into late summer and early fall. That doesn’t guarantee a weak August, but it does argue for staying alert. It’s like driving into a stretch of winding road. You don’t slam the brakes, you just keep both hands on the wheel.

How to Track the Overall Market’s Performance

For a bird’s-eye view, the StockCharts Market Summary is your go-to page, but, after drilling down, one chart I often visit in my Market Analysis ChartList is the 3-year weekly chart of the S&P 500, with its Bullish Percent Index (BPI) and the percentage of S&P 500 stocks trading above their 200-day moving average.

FIGURE 3. WEEKLY CHART OF S&P  500 WITH MARKET BREADTH INDICATORS. From a weekly perspective, the S&P 500 is still trending higher. Breadth indicators support the bullish move.Chart source: StockCharts.com. For educational purposes.

The trend is still higher, although the range between the open and close is relatively narrow. The BPI is above 50 but is flattening out, and the percentage of stocks trading above their 200-day moving average is also declining. Neither breadth indicator suggests we’ll see a massive selloff in the coming days.

The Cboe Volatility Index ($VIX) is low, and investor sentiment leans bullish (you can confirm this in the Sentiment panel of the Market Summary page).

Will Growth Lead For the Rest of the Year?

There are lots of variables that can change from now to the end of the year, from government policy to geopolitical tensions. These changes will be reflected in the market breadth and sentiment charts.

Tip: StockCharts members can download the Market Summary ChartPack to include the charts from the page in their ChartLists. You need to keep an eye on these charts for leading signals of change in the market’s price action.


End-of-Week Wrap-Up

Stock Market Weekly Performance

  • Dow Jones Industrial Average: 44,342.19 (-0.07%)
  • S&P 500: 6,296.79 (+0.59%)
  • Nasdaq Composite: 20,895 (+1.51%)
  • $VIX: 16.41 (+0.06%)
  • Best performing sector for the week: Technology
  • Worst performing sector for the week: Energy
  • Top 5 Large Cap SCTR stocks:  AST Spacemobile, Inc.(ASTS); Nuscale Power Corp. (SMR); Robinhood Markets Inc. (HOOD); Avis Budget Group (CAR); Symbiotic, Inc. (SYM)

On the Radar Next Week

  • June Home Sales
  • June Durable Goods Orders
  • Several Fed speeches
  • Earnings from Alphabet, Inc. (GOOGL), Tesla, Inc. (TSLA), AT&T Inc. (T), Intel Corp. (INTC), International Business Machines (IBM), and many more.

Disclaimer: This blog is for educational purposes only and should not be construed as financial advice. The ideas and strategies should never be used without first assessing your own personal and financial situation, or without consulting a financial professional.
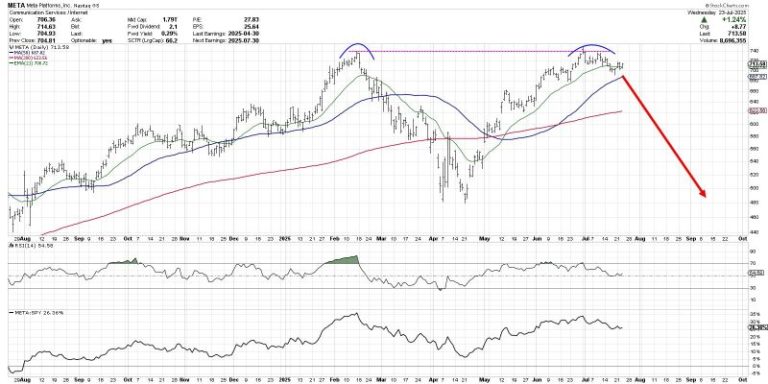
The chart of Meta Platforms, Inc. (META) has completed a roundtrip from the February high around $740 to the April low at $480 and all the way back again.  Over the last couple weeks, META has now pulled back from its retest of all-time highs, leaving investors to wonder what may come next.

Is this the beginning of a new downtrend phase for META?  Or just a brief pullback before a new uptrend phase propels META to new all-time highs?

Today we’ll look at two potential scenarios, including the double top pattern and the cup and handle pattern, and share which technical indicators and approaches could help us determine which path plays out into August.

The double top scenario basically means that the late July retest of the previous all-time high was the end of the recent uptrend phase.  The double top pattern is literally when a major resistance level is set and then retested.  The implication is that a lack of willing buyers means the uptrend is exhausted, and there is nowhere to go but down.

While the 21-day exponential moving average is currently in play for META, I would say that a break below the 50-day moving average could confirm this as the correct scenario.  If that smoothing mechanism does not hold, then the price action would imply less of a pullback and more like the beginning of a real distribution phase.

What is META pulls back but then resumes an uptrend phase, leading META to another new all-time high?  That would result in a confirmed cup and handle pattern, created by a large rounded bottoming pattern followed by a brief pullback.  The key to this pattern is the “rim” of the cup, which sits right at $740 for META.

Given the pullback META has demonstrated so far in July, I would say that a break above the $740 level would basically confirm a bullish cup and handle pattern.  That would suggest much more upside potential for META, as the stock would literally go into previously uncharted territory.

So how can we determine which scenario is more likely to play out?  This is where we need to incorporate more technical indicators into the discussion, as a way to further validate and confirm our investment thesis.

Just to review, I think a break above $740 would confirm a bullish cup and handle pattern.  I would also say that a break below the $680 level, which would represent a move below the 50-day moving average as well as the June swing lows, would basically confirm a bearish double top pattern.

We can also use the Relative Strength Index (RSI) to help determine whether META remains in a bullish trend phase.  During bull phases, the RSI rarely gets below 40, because buyers usually step in to “buy the dips” and keep the momentum fairly constructive.  So if the price would break down, and the RSI would not hold that crucial 40 level, that could mean a bearish outlook is warranted.

Finally, we can use volume-based indicators to assess whether moves in the price are supported by stronger volume readings.  Here I’ve included the Accumulation/Distribution Line, which tracks the trend in daily volume readings over time.  We can see that the high in July resulted in a divergence, as the A/D line was trending lower.  If the A/D line would break below its June and July lows, marked by a dashed red line, that would represent a bearish volume reading for META.

Technical analysis is less about predicting the future, and more about determining the most probable scenarios based on our analysis of trend, momentum, and volume.  I hope this discussion shows how the outlook for META can be easily determined and tracked using the best practices of technical analysis!

RR#6,

Dave

PS- Ready to upgrade your investment process?  Check out my free behavioral investing course!

David Keller, CMT

President and Chief Strategist

Sierra Alpha Research LLC

marketmisbehavior.com

https://www.youtube.com/c/MarketMisbehavior

Disclaimer: This blog is for educational purposes only and should not be construed as financial advice.  The ideas and strategies should never be used without first assessing your own personal and financial situation, or without consulting a financial professional.  

The author does not have a position in mentioned securities at the time of publication.    Any opinions expressed herein are solely those of the author and do not in any way represent the views or opinions of any other person or entity.

Markets don’t usually hit record highs, risk falling into bearish territory, and spring back to new highs within six months. But that’s what happened in 2025.

In this special mid-year recap, Grayson Roze sits down with David Keller, CMT, to show how disciplined routines, price-based signals, and a calm process helped them ride the whipsaw instead of getting tossed by it. You’ll see what really happened under the surface, how investor psychology drove the swings, and the exact StockCharts tools they leaned on to stay objective. 

If you’re focused on protecting capital, generating income, and sleeping well at night while still capturing the upside, this is a must-watch. Discover which charts deserve your attention now, what to ignore, and how to prep for the back half of 2025. 

This video premiered on July 23, 2025. Click on the above image to watch on our dedicated Grayson Roze page on StockCharts TV.

You can view previously recorded videos from Grayson at this link.

The stock market feels like it’s holding its breath ahead of Big Tech earnings. The first two days of the trading week were mostly quiet, but Tuesday gave us a few nuggets worth chewing on.

The S&P 500 ($SPX) squeaked out another record close, up by a modest +0.06%. It’s barely a blip, but it keeps the uptrend intact.

Tech momentum slowed down a tad, but we didn’t see a wave of selling. It was more like a little profit-taking after a strong run. No reason to hit the panic button just yet.


StockCharts Tip: Head to the Market Summary page and take a glance at the Market Factors panel. On Tuesday, Large-Cap Growth and Large-Cap Momentum were the only factors in the red (see image below).


FIGURE 1. MARKET FACTORS PANEL IN THE MARKET SUMMARY PAGE. Here you see the one-day performance metrics of the factors. You can change the timeframe using the dropdown menu at the top of the page. Image source: StockCharts.com. For educational purposes.

In the US Sectors panel in the Market Summary page, Technology was the lone S&P 500 sector that finished lower. Tuesday’s action can be seen in the StockCharts MarketCarpet of the S&P 500, based on a one-day performance.

FIGURE 2. MARKETCARPET FOR THE S&P 500. The Technology sector took a bit of a hit on Tuesday, but other sectors saw gains. Image source: StockCharts.com. For educational purposes.

The big names — NVIDIA (NVDA), Microsoft Corp. (MSFT), Amazon.com (AMZN), Meta Platforms (META), and Broadcom (AVGO) — were all in the laggard camp. This pause in tech stocks comes right before a wave of Big Tech earnings.

Some of the big tech companies reporting earnings this week are Alphabet, Inc. (GOOGL), Tesla, Inc. (TSLA), and International Business Machines (IBM). All three report on Wednesday after the close. If GOOGL and TSLA come in hot with solid numbers and upbeat guidance, the S&P 500 and Nasdaq Composite ($COMPQ) could catch a tailwind. (Fun fact: both stocks closed higher on Tuesday.)

Despite Tuesday’s tech wobble, major support levels are holding. The Nasdaq Composite remains comfortably above its 20-day exponential moving average (EMA), and breadth is improving (see chart below).

FIGURE 3. DAILY CHART OF THE NASDAQ COMPOSITE. The index is above its 20-day exponential moving average, and market breadth is improving. Chart source: StockCharts.com. For educational purposes.

Small Caps Still in the Game

We’re also seeing small-cap stocks rising. When small-caps participate in the market’s upside move, it’s an indication of a healthy stock market. Healthcare stocks represent a significant portion of the small-cap indexes, which explains why Health Care was the top-performing sector on Tuesday. 

Another area that stole the spotlight was homebuilders. The SPDR S&P Homebuilders ETF (XHB) broke above its 200-day simple moving average (SMA), a positive sign for the struggling industry group (see chart below). Its Relative Strength Index (RSI) indicates that momentum is relatively strong.

FIGURE 4. SPDR S&P HOMEBUILDERS ETF (XHB). The ETF broke above its 200-day simple moving average, and momentum is relatively strong. XHB has underperformed SPY over the last year. Chart source: StockCharts.com. For educational purposes.

Over the last year, XHB has lagged the SPDR S&P 500 ETF (SPY) by roughly 18%. Strong earnings from DR Horton, Inc. (DHI) and PulteGroup, Inc. (PHM), however, have given the group a welcome boost, even with a soft housing backdrop. We’ll get the June Existing Home Sales data on Wednesday. A stronger-than-expected report could add fuel to XHB’s rally.


StockCharts Tip: The XHB chart above is part of the  Market Summary ChartPack, which is free for StockCharts subscribers. Install it, and you’ll have a ready-to-use list of charts for days like this.


Also worth a peek is the U.S. Dow Jones Home Construction Index ($DJUSHB), which topped the Dow Industries list (check the US Industries panel in Market Summary and hit the Dow Industries tab).

Gold and Silver Nudge Higher

While tech cooled and home builders heated up, precious metals prices climbed higher. Gold ($GOLD) rose 0.92% and silver ($SILVER) gained 0.94%. Gold sits just under its all-time high, and silver is back to levels we haven’t seen since 2011.

The Big Picture: Still a Healthy Market Environment

None of Tuesday’s actions suggests a crack in the market’s growth story. We are in the thick of earnings season, and that always brings uncertainty and volatility. Expectations are high for Big Tech, especially in light of a weaker dollar. Stay patient, watch the price action, and let the charts guide your next move.


Disclaimer: This blog is for educational purposes only and should not be construed as financial advice. The ideas and strategies should never be used without first assessing your own personal and financial situation, or without consulting a financial professional.
Sector Rotation Stalls, Tech Remains King

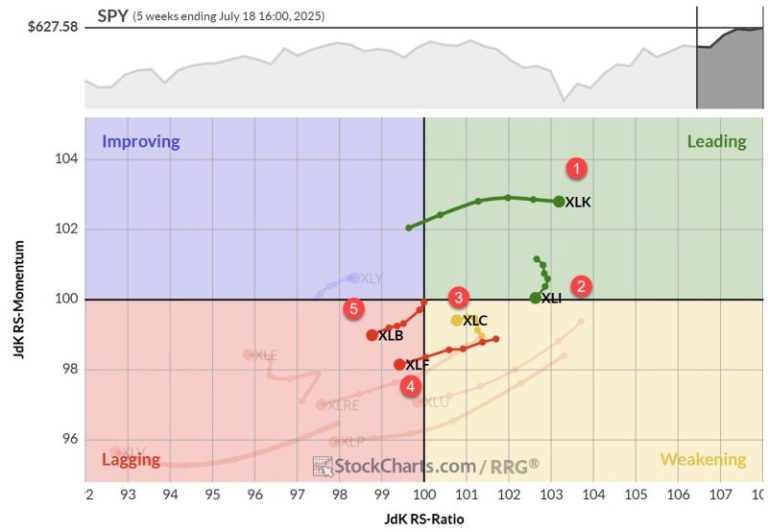
Despite a slight rise in the S&P 500 over the past week, the sector rotation landscape is presenting an intriguing picture. For the first time in recent memory, we’re seeing absolutely no changes in the composition of the sector ranking — not just in the top five, but across the board. Will this stability kick off a return to a period of more significant trends in relative strength and a return to outperformance for the portfolio?

  1. (1) Technology – (XLK)
  2. (2) Industrials – (XLI)
  3. (3) Communication Services – (XLC)
  4. (4) Financials – (XLF)
  5. (5) Materials – (XLB)
  6. (6) Utilities – (XLU)
  7. (7) Consumer Discretionary – (XLY)
  8. (8) Consumer Staples – (XLP)
  9. (9) Real-Estate – (XLRE)
  10. (10) Energy – (XLE)
  11. (11) Healthcare – (XLV)

Technology

The tech sector continues to flex its muscles, moving up on the price ratio scale while maintaining a stable momentum around 103. This sustained strength is a clear indication that tech remains the sector to beat in the current market environment.

On the daily RRG, we’re seeing a nice rotation backup for tech while inside the weakening quadrant, a sign of strength that confirms the move on the weekly RRG. The raw RS line for tech is climbing almost straight up, reflecting very strong RRG lines. There might be a slight loss of momentum, but make no mistake, tech is still the strongest player in the game.

Industrials

Industrials is currently rotating out of the leading quadrant and sits on the verge of moving into weakening. However, it’s crucial to note that it still holds the second-highest rank based on the RS ratio. This positioning suggests that the odds for a rotation back up towards the leading quadrant are still in play.

The daily RRG shows industrials confirming its strength with a move further into the leading quadrant, moving up on the RS ratio scale while keeping stable momentum.

After breaking out of overhead resistance, the price chart continues higher, and a new higher low is visible on the relative strength line. This keeps the RS ratio line at elevated levels, though the RS momentum line is still moving lower just above 100. If this RS line can maintain a series of higher highs or higher lows, I expect the RS momentum line to bottom out soon and follow the RS ratio higher.

Communication Services

The communication services sector is positioned inside the weakening quadrant on the weekly RRG but has hooked back to the left and is now even lower on the RS ratio scale. It’s moving towards the lagging corner, which is a concerning trend for its top 5 position.

On the daily RRG, communication services have moved into the lagging quadrant. It has started to slow down on the negative momentum, but we need a rotation back up on this daily RRG into the improving quadrant and back to leading to have that weekly tail curl back up to its leading quadrant as well.

The price chart shows the sector holding up after breaking higher, with a pullback now finding support at the level of old resistance, respecting the rule that old resistance is expected to work as support going forward. The problem child here is the raw RS line, which has fallen below its rising support line. This is taking its toll on the RRG lines, with both RS ratio and RS momentum rolling over and starting to move down.

Financials

Financials are inside the lagging quadrant on the weekly RRG, moving at a negative heading. This means that a significant amount of strength is needed from the daily tail to keep this sector within the top five.

On the price chart, financials are playing around with overhead resistance around 52, with a small consolidation area and a pennant-like formation suggesting more upside potential on the price chart.

However, this is not confirmed on the relative strength chart, where the RS line has broken its rising trend and is moving lower.

Materials

Materials are also inside the lagging quadrant on the weekly RRG and traveling a negative heading, like financials. Here, also, strength is needed from the daily teams to keep the sector inside the top five.

Materials are holding up on the price chart after a break that could be described as a head-and-shoulders reversal pattern. The relative strength line remains contained within the boundaries of its falling channel, but hugging the falling resistance line.

We need a break higher to turn that trend around. Only an upward breakout of that relative downtrend will turn the RRG lines around and provide a lifeline for materials to maintain its position inside the top five.

Portfolio Performance

The portfolio continues to lag the S&P 500, currently sitting around 8% behind. It seems to be stabilizing for now, but it’s not exactly what we want, of course. A drawdown of around 8-10% is not unprecedented, based on historical backtests; however, it’s somewhat disappointing that it occurs right when we begin operating in a semi-live environment.

That said, the fact that we’re now stable with no changes after a period of significant volatility over recent months could be a sign that we’re ready to enter a new period with stable relative trends that can bring the portfolio back to outperformance.

#StayAlert and have a great week. –Julius


Is the market’s next surge already underway? Find out with Tom Bowley’s breakdown of where the money is flowing now and how you can get in front of it.

In this video, Tom covers key moves in the major indexes, revealing strength in transports, small caps, and home construction. He identifies industry rotation signals, which are pointing to aluminum, recreational products, and furnishings. Tom then demonstrates how to use StockCharts’ tools to scan for momentum stocks in emerging leadership groups — see why SGI tops Tom’s list. He ends with a discussion of post-earnings reactions from major names like GOOGL, TSLA, IBM, and LVS. 

And, of course, Tom wraps every idea with clear chart setups you can act on today. 

This video premiered on July 24, 2025. Click this link to watch on Tom’s dedicated page.

Missed a session? Archived videos from Tom are available at this link.

Here are some charts that reflect our areas of focus this week at


XLU Leads with New High

Even though the Utilities SPDR (XLU) cannot keep pace with the Technology SPDR (XLK) and Communication Services SPDR (XLC), it is in a leading uptrend. XLU formed a cup-with-handle from November to July and broke to new highs the last two weeks. ETFs hitting new highs are in strong uptrends and should be on our radar.


Metal Mania in 2025

In a tribute to Ozzy, metals are leading the way higher in 2025. The PerfChart below shows year-to-date performance for the continuous futures for 12 commodities. Copper, Platinum and Palladium are up more than 45% year-to-date, while Gold is up 28.38% and Silver is up 35.30%. QQQ is up 10.52% year-to-date, but lagging these metals. The other commodities are mixed.


Multi-Year Highs for Silver and Copper

The next chart shows 11 year bar charts for five metals. Gold broke out in early 2024 and led the metals move with an advance the last 21 months. Silver and copper broke out to multi-year highs. Platinum broke above its 2021 high and Palladium got in the action with an 18 month high. There is a clear message here: metals are moving higher and leading as a group.  


Home Construction Hits Moment of Truth

The Home Construction ETF (ITB) hit its moment of truth as it rose to its falling 40-week SMA. Notice that ITB failed just below this moving average in August 2023. During the 2023-2024 uptrend, the 40-week SMA was more friendly as ITB reversed near this level in October 2023 and June 2024. ITB surged to the falling 40-week SMA in July, but the long-term trend is down and this area could be its nemesis.

Thanks for Tuning in!

See TrendInvestorPro.com for more


The S&P 500 ($SPX) just logged its fifth straight trading box breakout, which means that, of the five trading ranges the index has experienced since the April lows, all have been resolved to the upside.

How much longer can this last? That’s been the biggest question since the massive April 9 rally. Instead of assuming the market is due to roll over, it’s been more productive to track price action and watch for potential changes along the way. So far, drawdowns have been minimal, and breakouts keep occurring. Nothing in the price action hints at a lasting change — yet.

While some are calling this rally “historic,” we have a recent precedent. Recall that from late 2023 through early 2024, the index had a strong start and gave way to a consistent, steady trend.

From late October 2023 through March 2024, the S&P 500 logged seven consecutive trading box breakouts. That streak finally paused with a pullback from late March to early April, which, as we now know, was only a temporary hiccup. Once the bid returned, the S&P 500 went right back to carving new boxes and climbing higher.

New 52-Week Highs Finally Picking Up

If there’s been one gripe about this rally, it’s that the number of new highs within the index has lagged. As we’ve discussed before, among all the internal breadth indicators available, new highs almost always lag — that’s normal. What we really want to see is whether the number of new highs begins to exceed prior peaks as the market continues to rise, which it has, as shown by the blue line in the chart below.

As of Wednesday’s close, 100 S&P 500 stocks were either at new 52-week highs or within 3% of them. That’s a strong base. We expect this number to continue rising as the market climbs, especially if positive earnings reactions persist across sectors.

Even when we get that first day with 100+ S&P 500 stocks making new 52-week highs, though, it might not be the best time to initiate new longs.

The above chart shows that much needs to align for that many stocks to peak in unison, which has historically led to at least a short-term consolidation, if not deeper pullbacks — as highlighted in yellow. Every time is different, of course, but this is something to keep an eye on in the coming weeks.

Trend Check: GoNoGo Still “Go”

The GoNoGo Trend remains in bullish mode, with the recent countertrend signals having yet to trigger a greater pullback.

Active Bullish Patterns

We still have two live bullish upside targets of 6,555 and 6,745, which could be with us for a while going forward. For the S&P 500 to get there, it will need to form new, smaller versions of the trading boxes.

Failed Bearish Patterns

In the chart below, you can view a rising wedge pattern on the recent price action, the third since April. The prior two wedges broke down briefly and did not lead to a major downturn. The largest pullbacks in each case occurred after the S&P 500 dipped below the lower trendline of the pattern.

The deepest drawdown so far is 3.5%, which is not exactly a game-changer. Without downside follow-through, a classic bearish pattern simply can’t be formed, let alone be broken down from.

We’ll continue to monitor these formations as they develop because, at some point, that will change.

Morocco has appointed its arbitrator in its ongoing legal battle with British miner Emmerson (LSE:EML,OTC Pink:EMMRF) under the International Center for Settlement of Investment Disputes (ICSID) in relation to the halted Khemisset potash project.

The ICSID confirmed on August 15 that Morocco nominated Professor Zachary Douglas KC, an international law scholar with Australian and Swiss nationality, as its representative on the tribunal.

Meanwhile, Emmerson had earlier selected Stanimir A. Alexandrov, a Bulgarian national and veteran of investor-state disputes, whose appointment was registered on August 5.

At the heart of the dispute is Emmerson’s Khemisset potash project, located about 90 kilometers northeast of Rabat.

The deposit, with estimated resources of 311 million tons at an average grade of 10.2 percent potassium oxide, was expected to produce more than 700,000 tons of potash annually over a 19-year mine life.

Emmerson promoted the project as one of the lowest-capital-cost developments globally and a potential anchor for Morocco in the international fertilizer market.

However, this vision unraveled when the Regional Unified Investment Commission (CRUI) issued an unfavorable environmental and social impact assessment. The commission concluded that the project’s projected water consumption could not be reconciled with local resources, effectively halting the development.

Emmerson called the rejection an unlawful interference with its rights under the 1990 Morocco–United Kingdom bilateral investment treaty, which came into force in 2002.

In May, the company filed a formal request for arbitration at ICSID, alleging that Morocco’s actions amounted to expropriation and a violation of investor protections.

The miner is now seeking compensation it values at US$2.2 billion — equivalent to the project’s assessed worth.

The London-based firm has also highlighted backing from a group of investors with prior arbitration experience, including involvement in GreenX’s (ASX:GRX,LSE:GRX) case against Poland.

Morocco, for its part, has appointed prominent attorney Hicham Naciri as its counsel. With both parties’ nominees now in place, the three-member tribunal requires only a jointly accepted president before hearings can begin.

Securities Disclosure: I, Giann Liguid, hold no direct investment interest in any company mentioned in this article.

This post appeared first on investingnews.com

West High Yield (W.H.Y.) Resources Ltd. (TSXV: WHY,OTC:WHYRF) (FSE: W0H) (the ‘Company’ or ‘West High Yield’) is very pleased to announce that the British Columbia Environmental Assessment Office (the ‘EAO ‘) has issued its Final Designation Decision confirming that the Company’s Record Ridge Industrial Minerals Project (the ‘Project’), near Rossland, British Columbia, will not be designated as a reviewable project under Section 11 of the Environmental Assessment Act (2018) (British Columbia) (the ‘Act’).

The EAO reviewed applications submitted under Section 11 of the Act and concluded that the Project’s potential effects are being appropriately addressed through existing regulatory processes, including the Mines Act (British Columbia) and the Environmental Management Act (British Columbia). The EAO’s Final Designation Report and Reasons for Decision are publicly available on the EAO’s Project Information Centre: EAO EPIC – Record Ridge Project Documents.

This Final Designation Decision follows the EAO’s earlier draft designation report, which reached the same conclusion. West High Yield previously issued a press release on May 28, 2025, welcoming the draft designation report ‘s findings: Read here.

‘We are pleased that the Environmental Assessment Office respected the opinion of the Osoyoos Indian Band and has allowed the Project to proceed,’ said Chief Clarence Louie of the Osoyoos Indian Band. ‘We look forward to working with the leadership of West High Yield to ensure this Project is of the highest standards in keeping with the traditions and expectations of our people.’

‘We are extremely pleased with the EAO’s Final Designation Decision, which validates the rigorous review our Project has already undergone through the Mine Development Review Committee process led by the British Columbia Ministry of Mining and Critical Minerals,’ said the Company’s President and CEO, Frank Marasco Jr. ‘This outcome provides the clarity and certainty we need to advance toward final permitting and development of the Project. We remain committed to building a sustainable operation that delivers critical minerals for Canada while protecting the environment and creating lasting benefits for local communities and Indigenous partners.’

The Project is a unique Canadian source of critical minerals, with a focus on magnesia (MgO) and silica (SiO2) products, both recognized as strategic and essential to the clean energy transition and a low-carbon economy. The Project has been reviewed by the British Columbia Mine Development Review Committee with input from provincial agencies, Indigenous Nations, and local governments, and has already advanced to the draft Mines Act (British Columbia) permit stage.

West High Yield remains committed to working in close collaboration with Indigenous partners, regulators, and stakeholders to ensure the responsible development of the Project as it advances toward final permitting.

About West High Yield

West High Yield is a publicly traded junior mining exploration and development company focused on acquiring, exploring, and developing mineral resource properties in Canada. Its primary objective is to develop its world-class Record Ridge critical mineral (magnesium, silica, and nickel) deposit using green processing techniques to minimize waste and CO2 emissions.

The Company’s Record Ridge critical mineral deposit located 10 kilometers southwest of Rossland, British Columbia has approximately 10.6 million tonnes of contained magnesium based on an independently produced National Instrument 43-101 – Standards of Disclosure for Mineral Projects (‘NI 43-101‘) Preliminary Economic Assessment technical report (titled ‘Revised NI 43-101 Technical Report Preliminary Economic Assessment Record Ridge Project, British Columbia, Canada’) prepared by SRK Consulting (Canada) Inc. on April 18, 2013 in accordance with NI 43-101 and which can be found on the Company’s profile at https://www.sedarplus.ca.

Qualified Person

Rick Walker, B.Sc., M.Sc., P.Geo., the Company Geologist is a Qualified Person as defined in NI 43-101 and has reviewed and approved the technical information in this press release.

Contact Information:

West High Yield (W.H.Y.) RESOURCES LTD.

Frank Marasco Jr., President and Chief Executive Officer
Telephone: (403) 660-3488
Email: frank@whyresources.com

Barry Baim, Corporate Secretary
Telephone: (403) 829-2246
Email: barry@whyresources.com

Cautionary Note Regarding Forward-looking Information

This press release contains forward-looking statements and forward-looking information within the meaning of Canadian securities legislation. The forward-looking statements and information are based on certain key expectations and assumptions made by the Company. Although the Company believes that the expectations and assumptions on which such forward-looking statements and information are based are reasonable, undue reliance should not be placed on the forward-looking statements and information because the Company can give no assurance that they will prove to be correct.

Forward-looking information is based on the opinions and estimates of management at the date the statements are made and are subject to a variety of risks and uncertainties and other factors that could cause actual events or results to differ materially from those anticipated in the forward-looking information. Some of the risks and other factors that could cause the results to differ materially from those expressed in the forward-looking information include, but are not limited to: general economic conditions in Canada and globally; industry conditions, including governmental regulation; failure to obtain industry partner and other third party consents and approvals, if and when required; the availability of capital on acceptable terms; the need to obtain required approvals from regulatory authorities; and other factors. Readers are cautioned that this list of risk factors should not be construed as exhaustive.

Readers are cautioned not to place undue reliance on this forward-looking information, which is given as of the date hereof, and to not use such forward-looking information for anything other than its intended purpose. The Company undertakes no obligation to update publicly or revise any forward-looking information, whether as a result of new information, future events or otherwise, except as required by applicable law.

NEITHER THE TSX VENTURE EXCHANGE NOR ITS REGULATION SERVICES PROVIDER (AS THAT TERM IS DEFINED IN THE POLICIES OF THE TSX VENTURE EXCHANGE) ACCEPTS RESPONSIBILITY FOR THE ADEQUACY OR ACCURACY OF THIS RELEASE.

To view the source version of this press release, please visit https://www.newsfilecorp.com/release/263234

News Provided by Newsfile via QuoteMedia

This post appeared first on investingnews.com